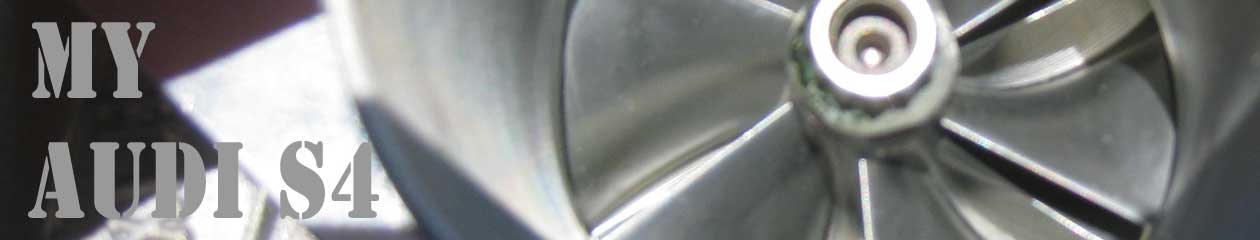
With stock K03’s, fueling, and MAF sensor the EGT model had proven to be a close match to the readings recorded via the full range RS6 EGT sensors on my car.
Stock tune on dyno:
K03 Stock Tune
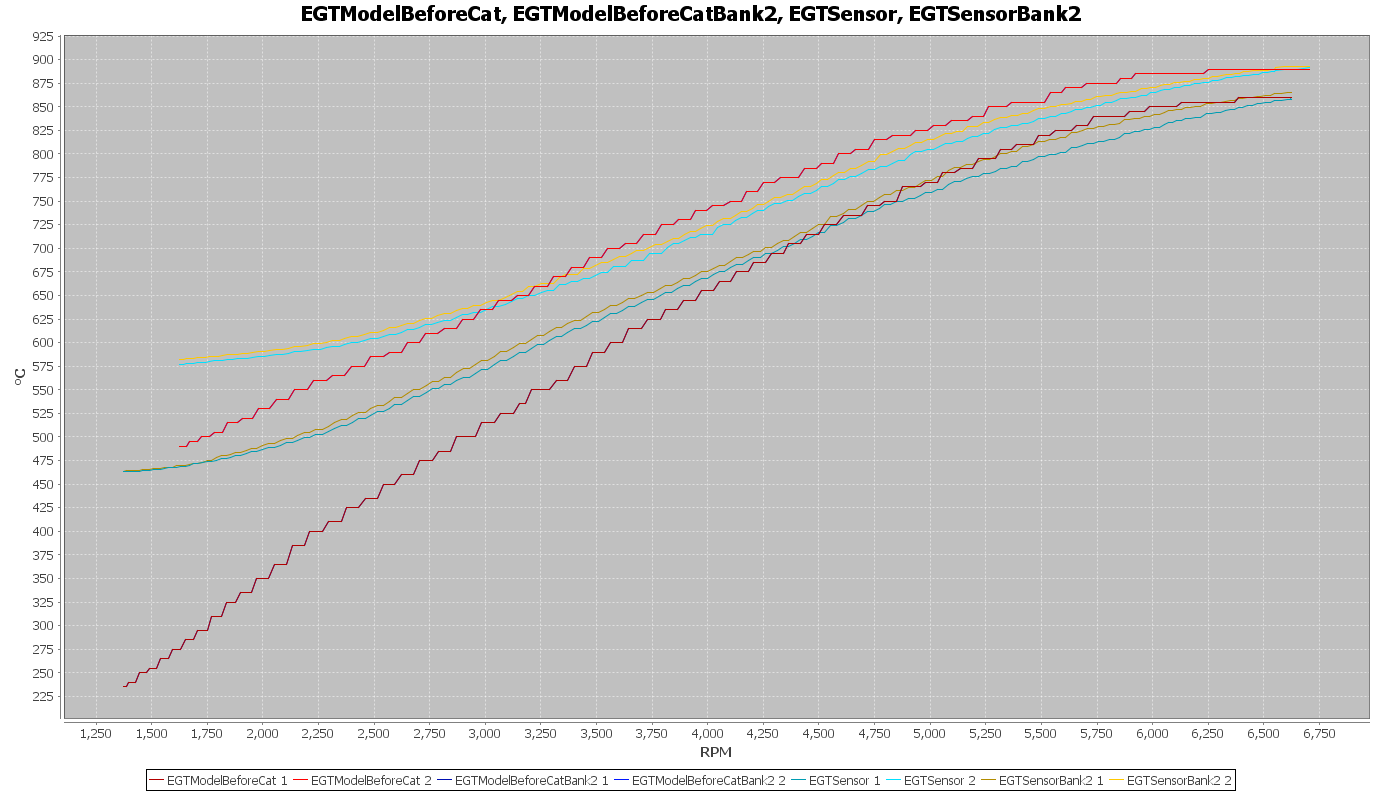
Nefmoto community tune on dyno:
Nefmoto Stg2 Tune
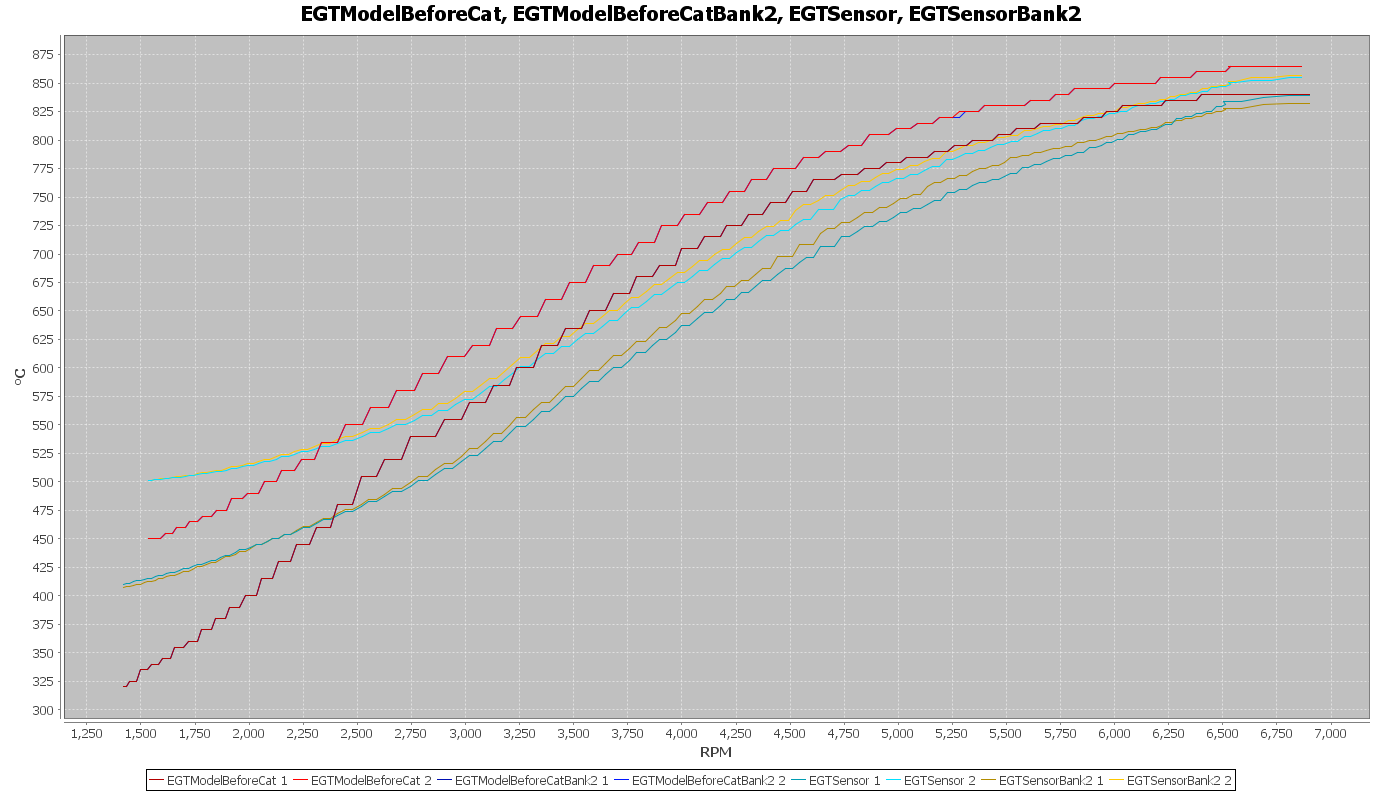
NVR tune on dyno:
NVR Stg2++ Tune
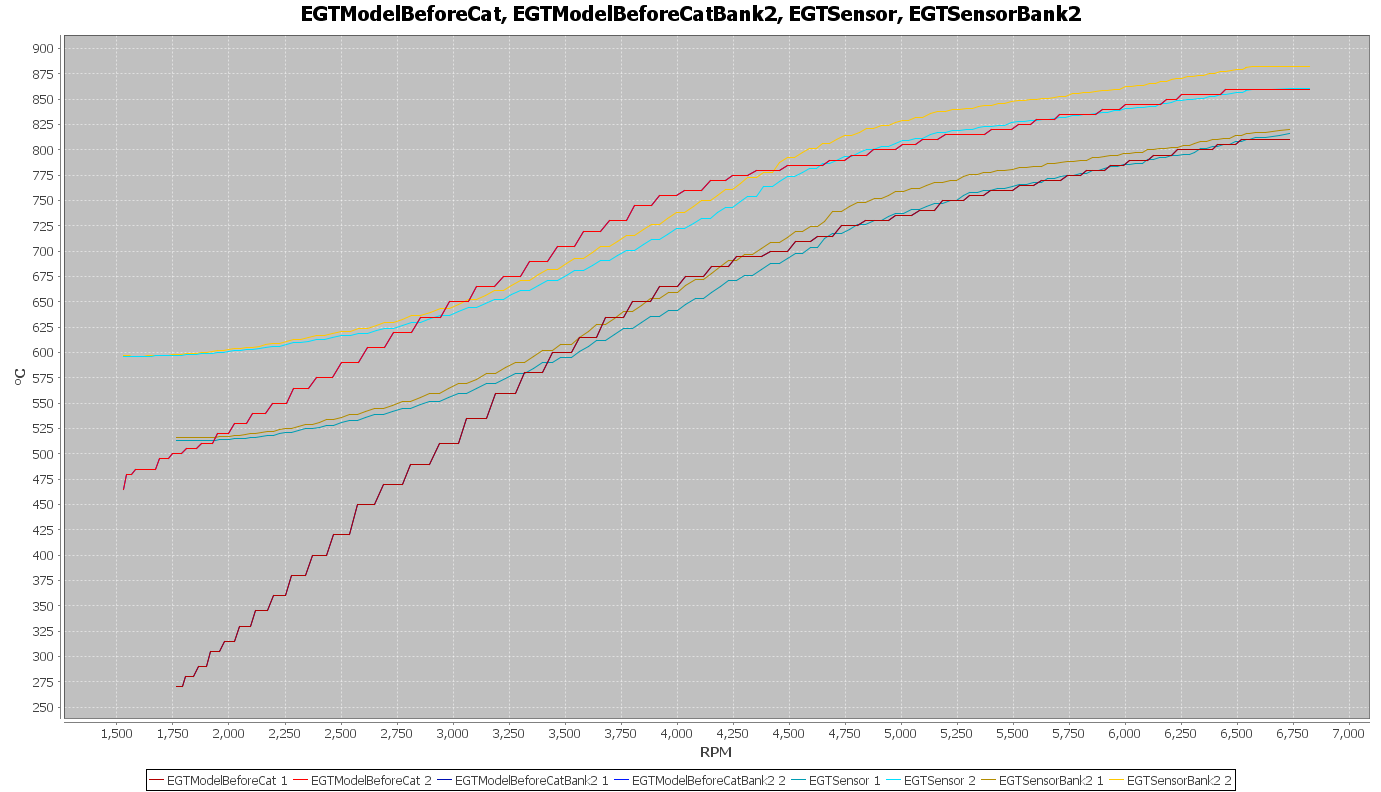
With my conversion over to RS4 K04’s, RS4 MAF sensor, and Bosch 72# EV14 fuel injectors I looked once more at how the modeled EGT’s compared with the readings from the RS6 EGT sensors.
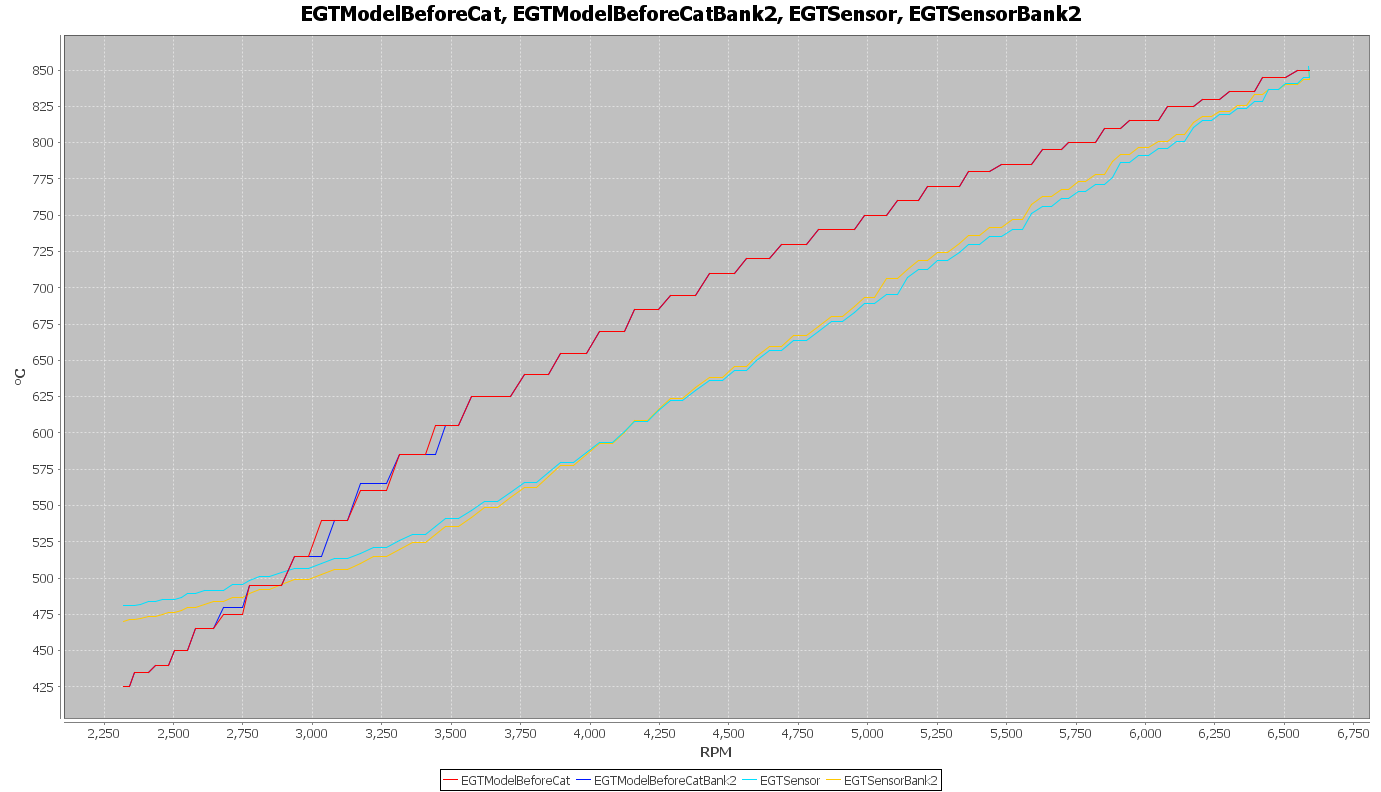
K04 Stg3 tune on Street:
Modeled EGT’s vs Measured EGT’s
With this setup on the street the modeled temperatures are becoming less accurate. The mid-range modeled temperatures exceed those recorded by the sensors.
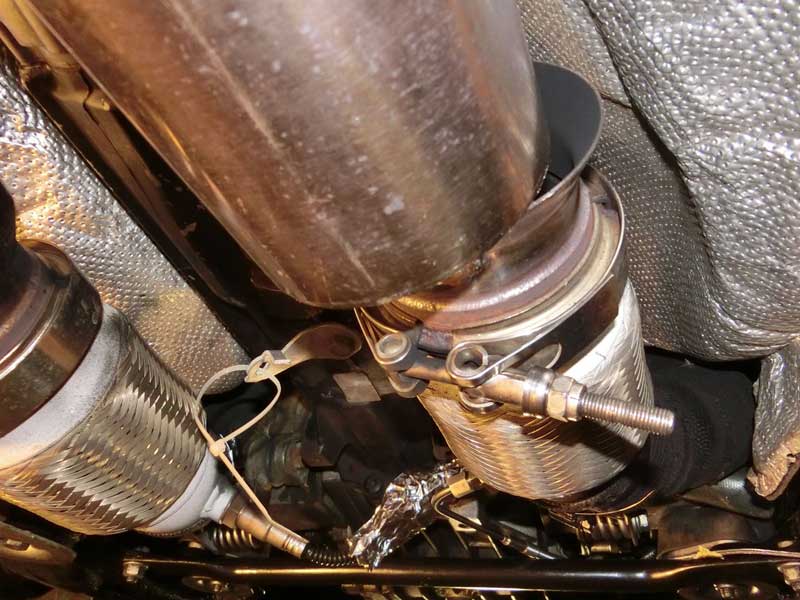
I was out the other day doing a pull when bang… braaa (very loud exhaust). “What the heck was that?” My first thought was a v-band clamp holding the mid-pipe to the downpipe let go and the exhaust separated. I brought the car back to the garage and took a look underneath:
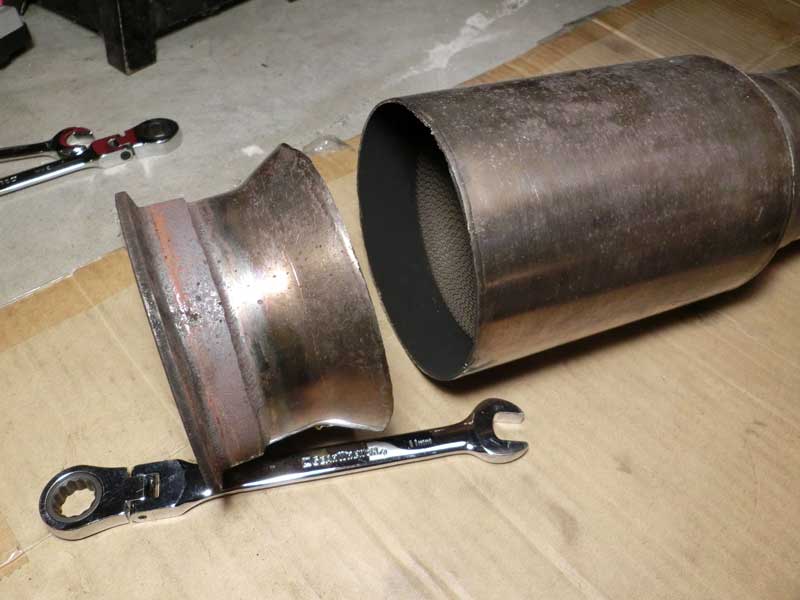
Oh, that’s not good. Something on my 034 Motorsport exhaust system failed. I detached the mid-pipes for a better look:
034 Motorsport Exhaust Mid-Pipe
A clean break right where the reducer attaches to the catalytic converter. Great, car is down and now I need to find a shop to weld it back together.
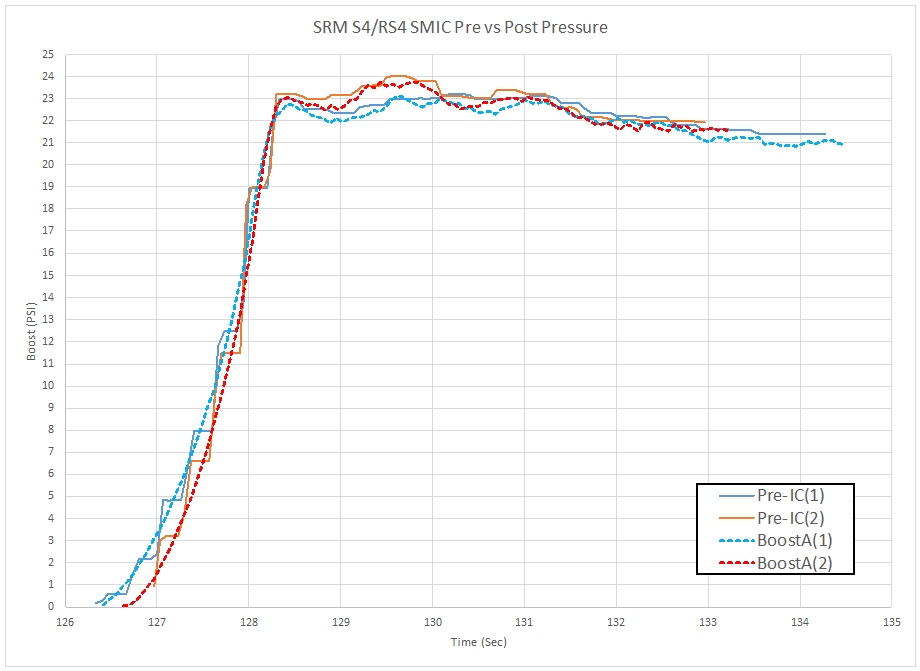
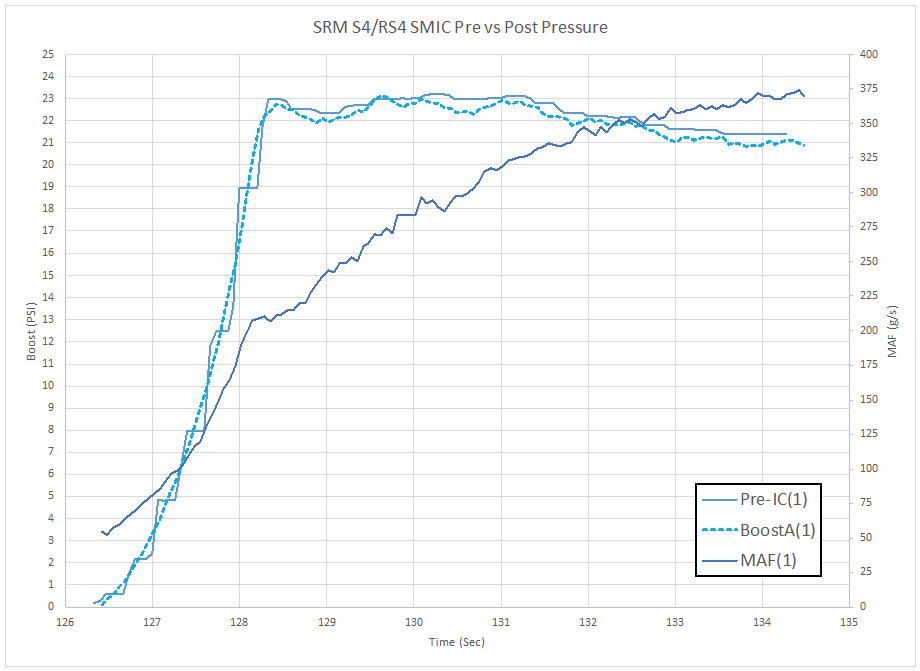
Here’s a chart showing pressure recorded right before the intercooler inlet versus the pressure recorded at the MAP sensor when using BW K04 turbochargers and the SRM Intercoolers.
SRM RS4 SMIC Pressure Differential
Under normal driving conditions the pre-intercooler sensor reads between 0.05 and 0.1 psi, which leads me to believe there is not much difference between the boost readings attributable to sensor accuracy.
The longer of the two pulls shown is out to approximately 6600 rpm.
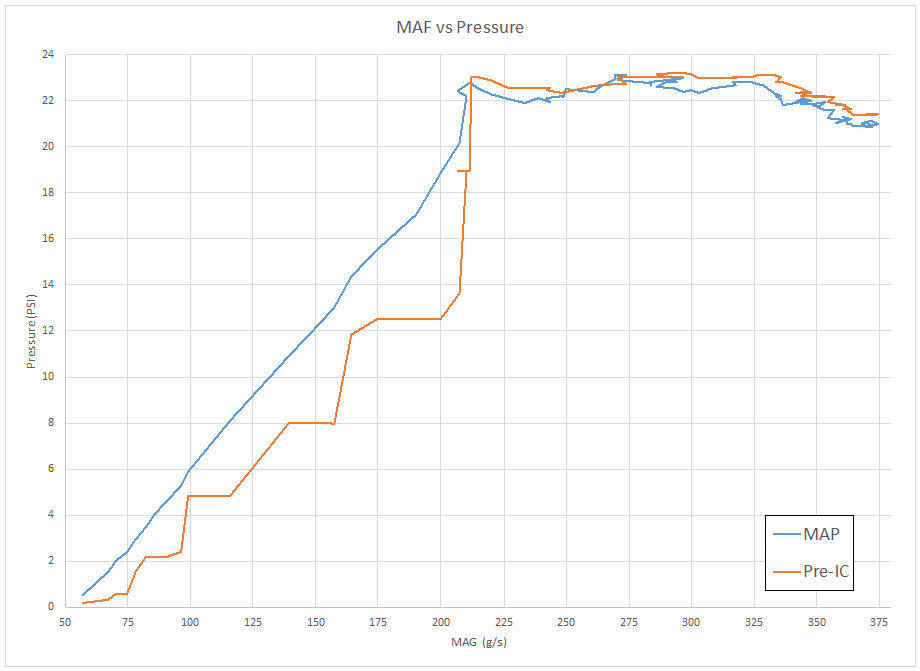
Below is the longer pull with MAF vs Pressure:
SRM RS4/S4 SMIC MAF vs Pressure
The difference below 200 g/s is probably due to the readings being taken by different data logging equipment. It is more difficult to match up data points when there isn’t a common reference data as used in the first chart where pressure from each sensor was plotted versus time.