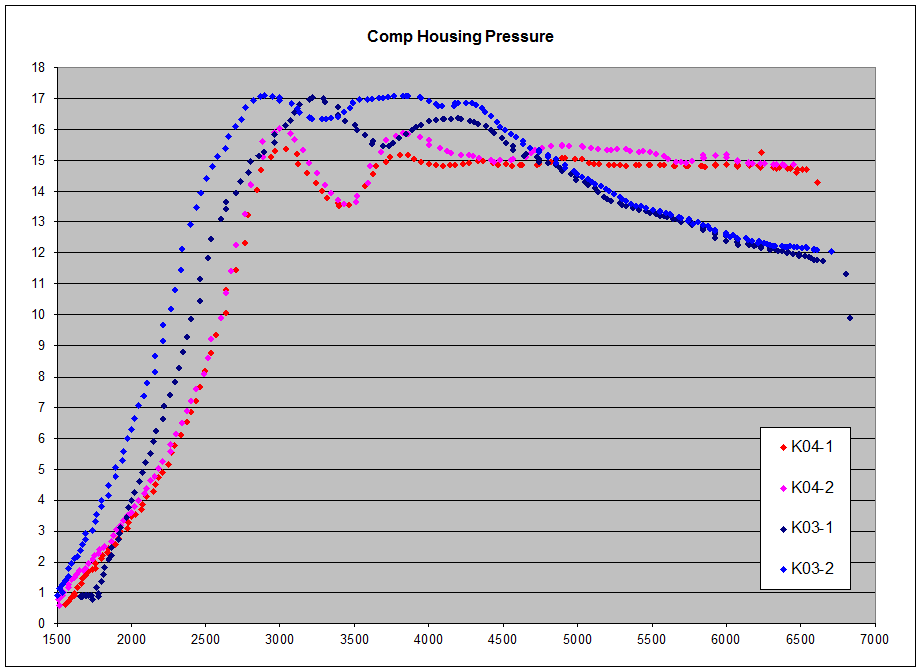
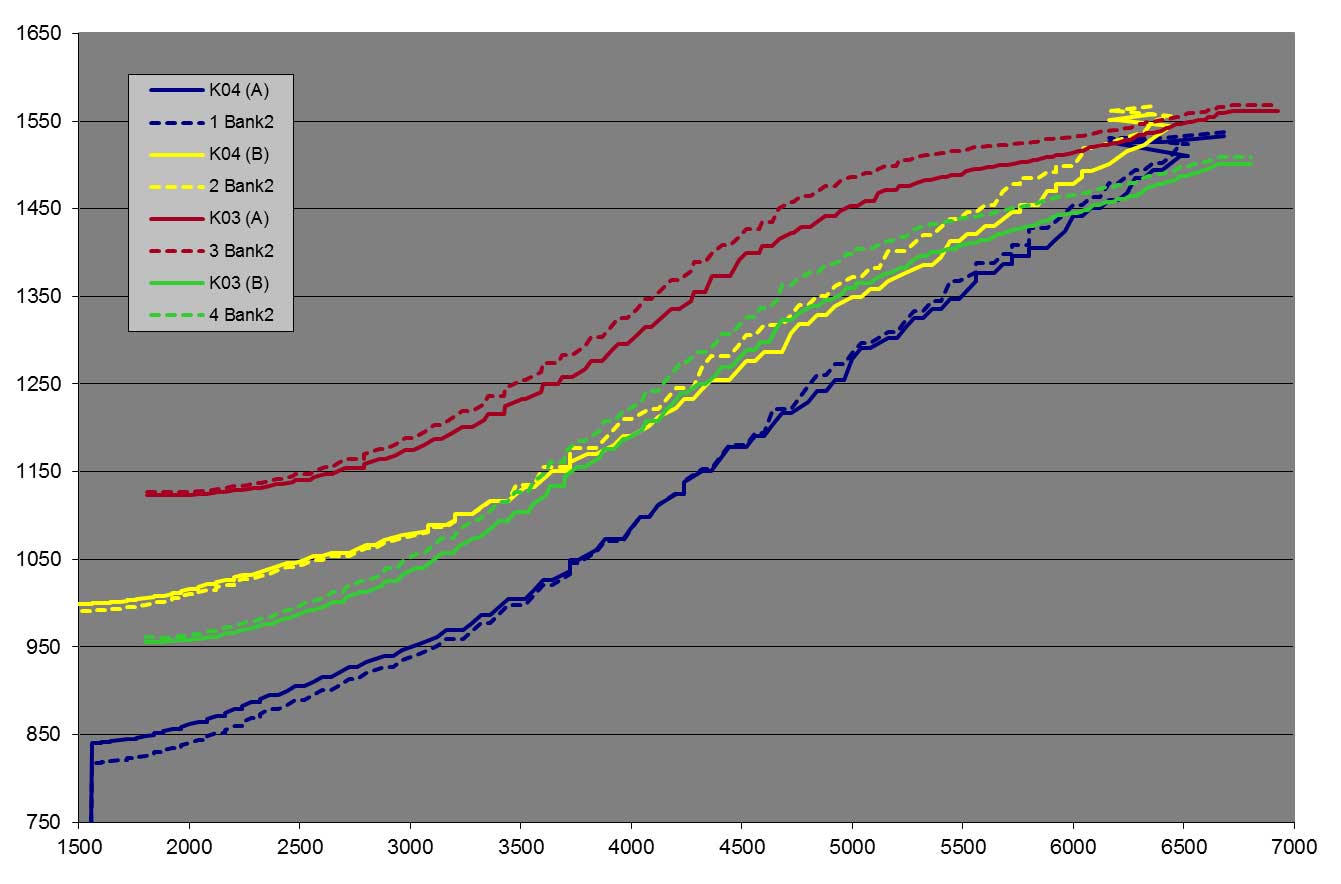
Here’s a surprising result, the chart shows the pressure in the signal line going to the N75 valve. The other end of this line is what taps into the turbocharger compressor housing.
K03 vs K04 Compressor Housing Pressure
The K04’s are operating at a higher Manifold pressure, but the reading from the compressor housing is less than what the K03 readings are for a K03 tune until about 5000 rpm, where the K03 tune drops manifold pressure significantly.
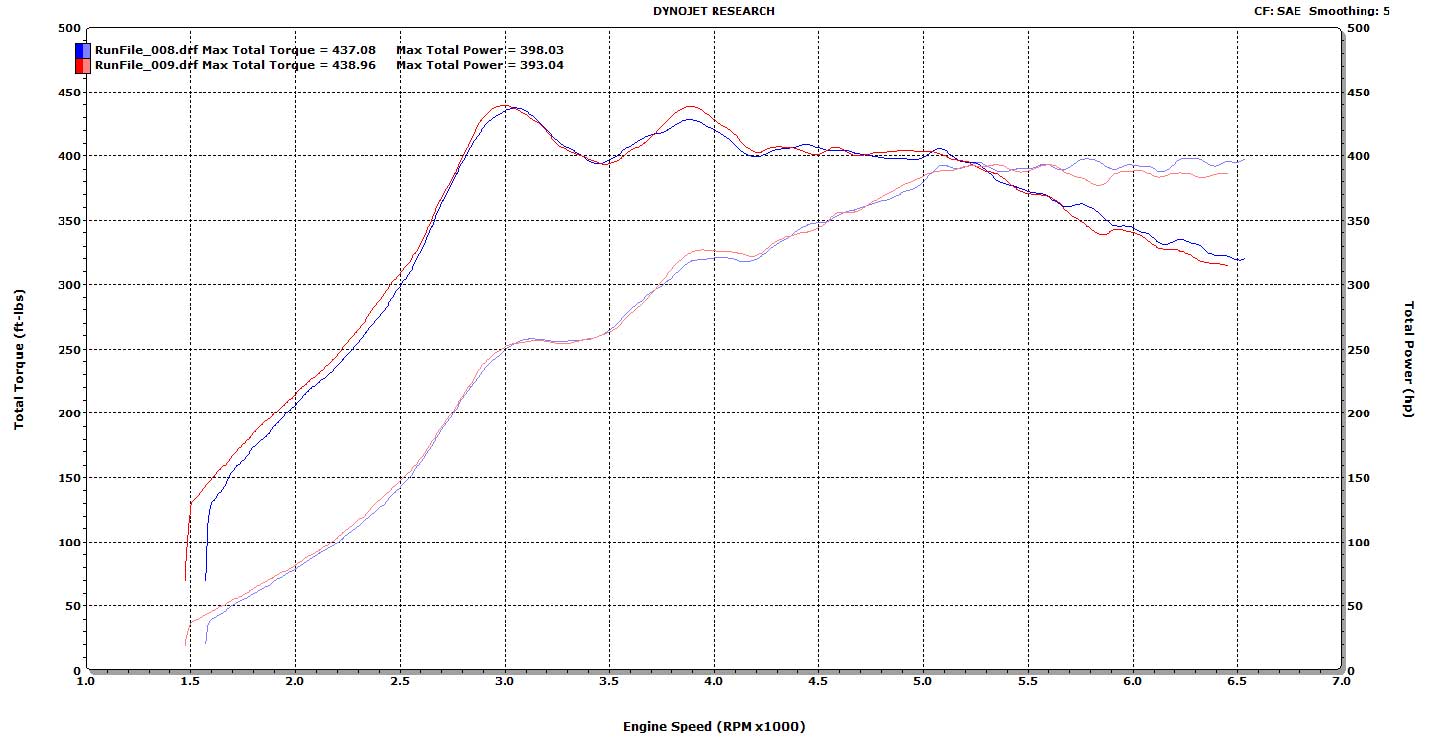
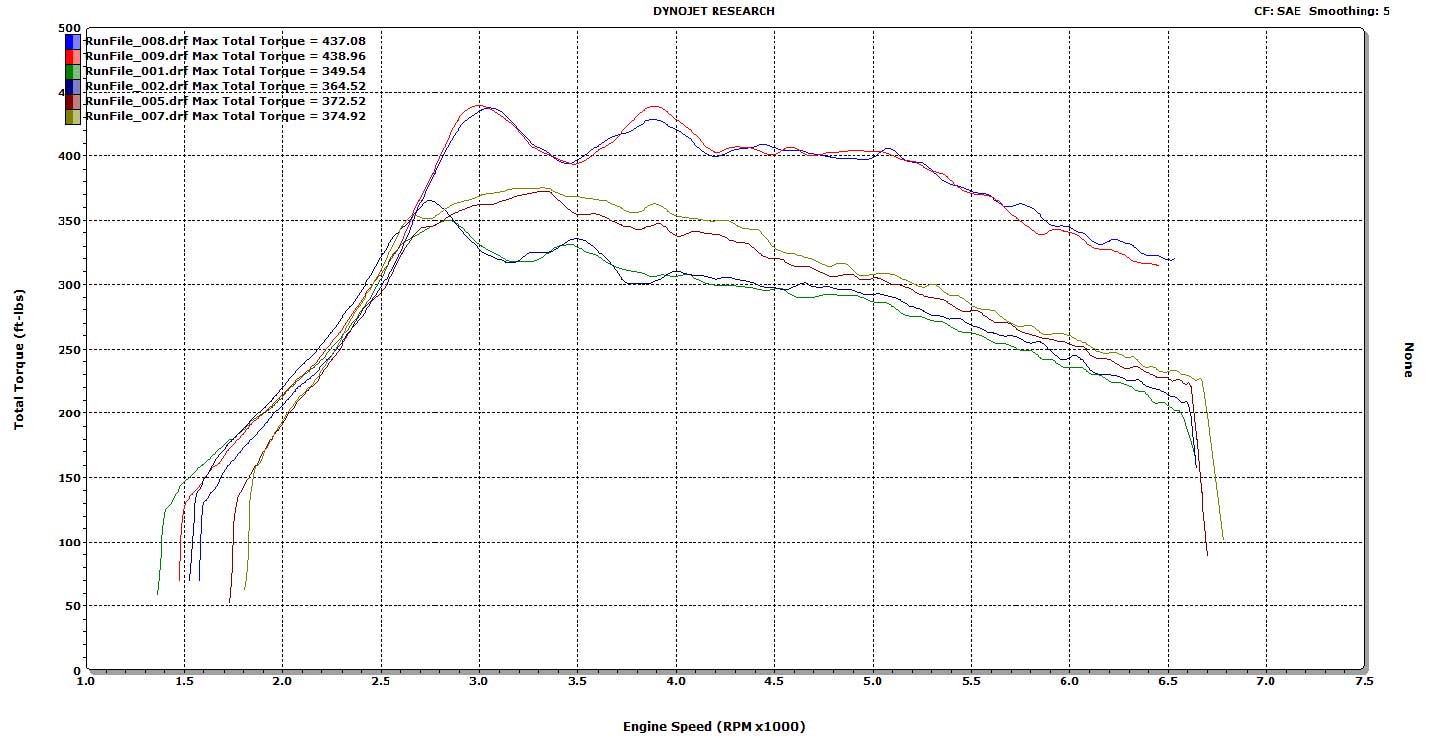
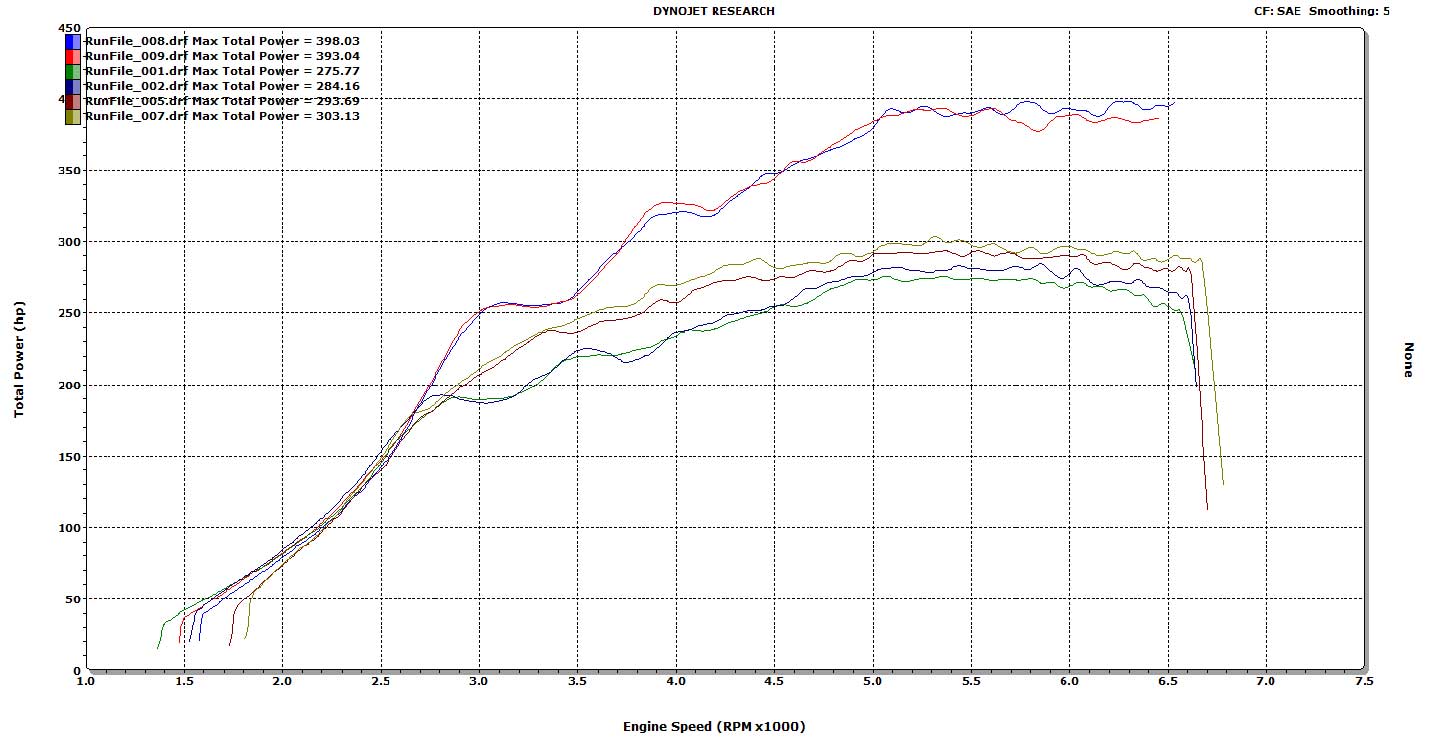
This morning the S4 went back onto the DynoJet dyno for a series of pulls with the BorgWarner K04’s and a moderate boost Daz tune.
The purpose of this session was to establish more baseline data for making comparisons to some aftermarket turbocharger options.
BW K04 baseline dyno pulls
The ‘final’ results peak dyno numbers are of less interest to me than the shape of the torque curve. I am expecting a K04-hybrid turbocharger to be capable of more peak torque and power than the RS4 K04.
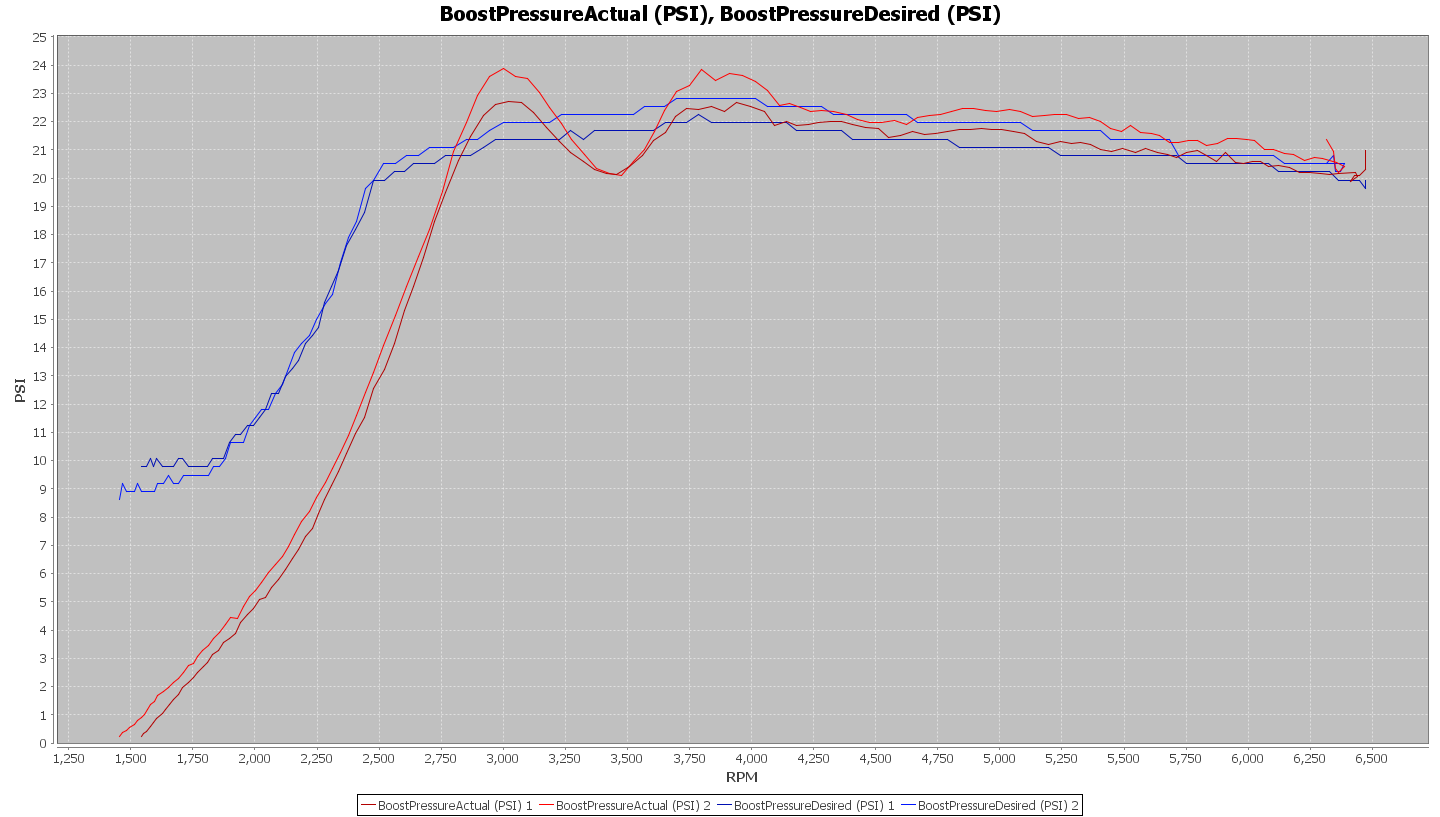
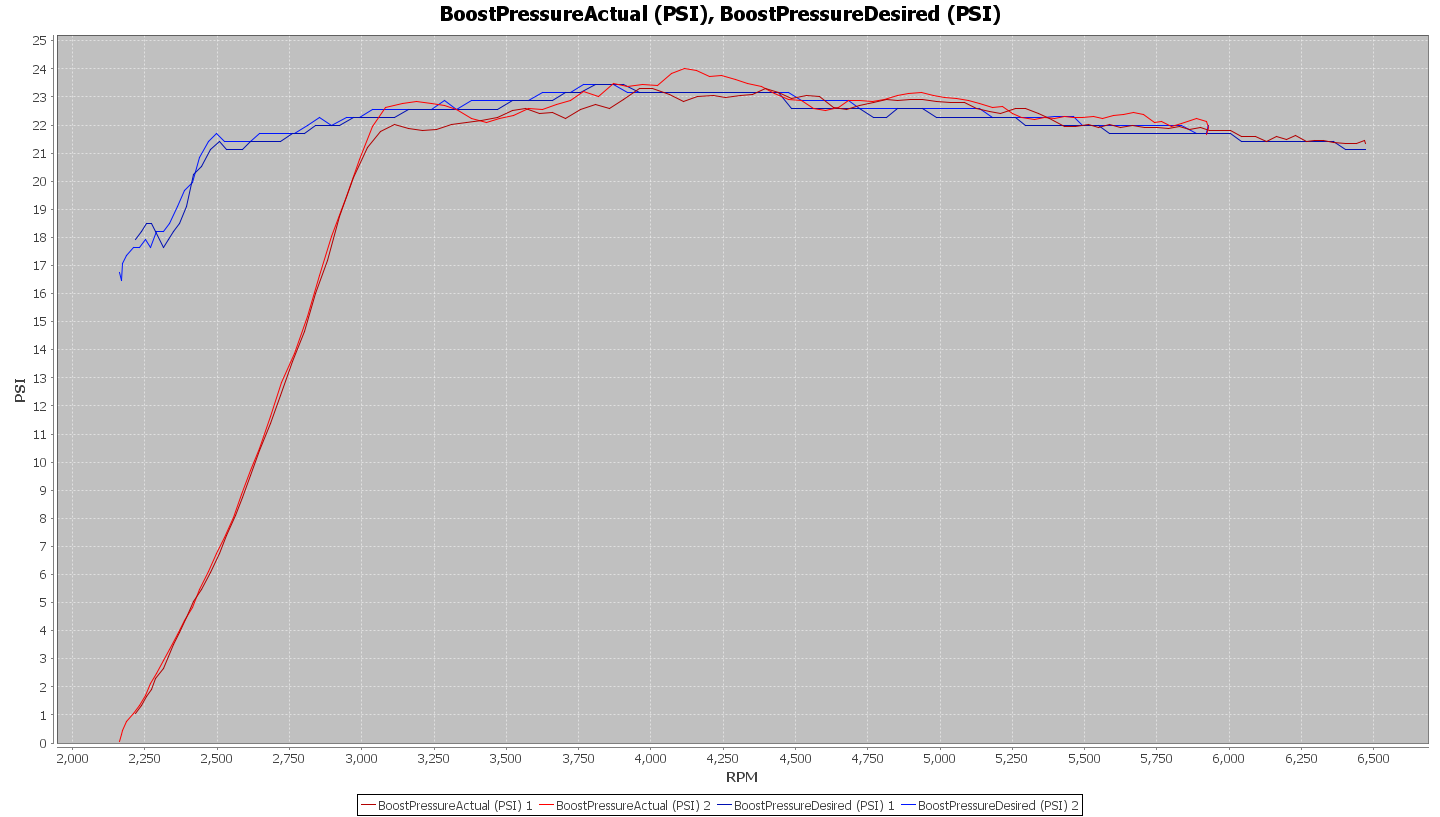
Here is the boost profile that this tune uses:
K04 Stg3 tune boost profile
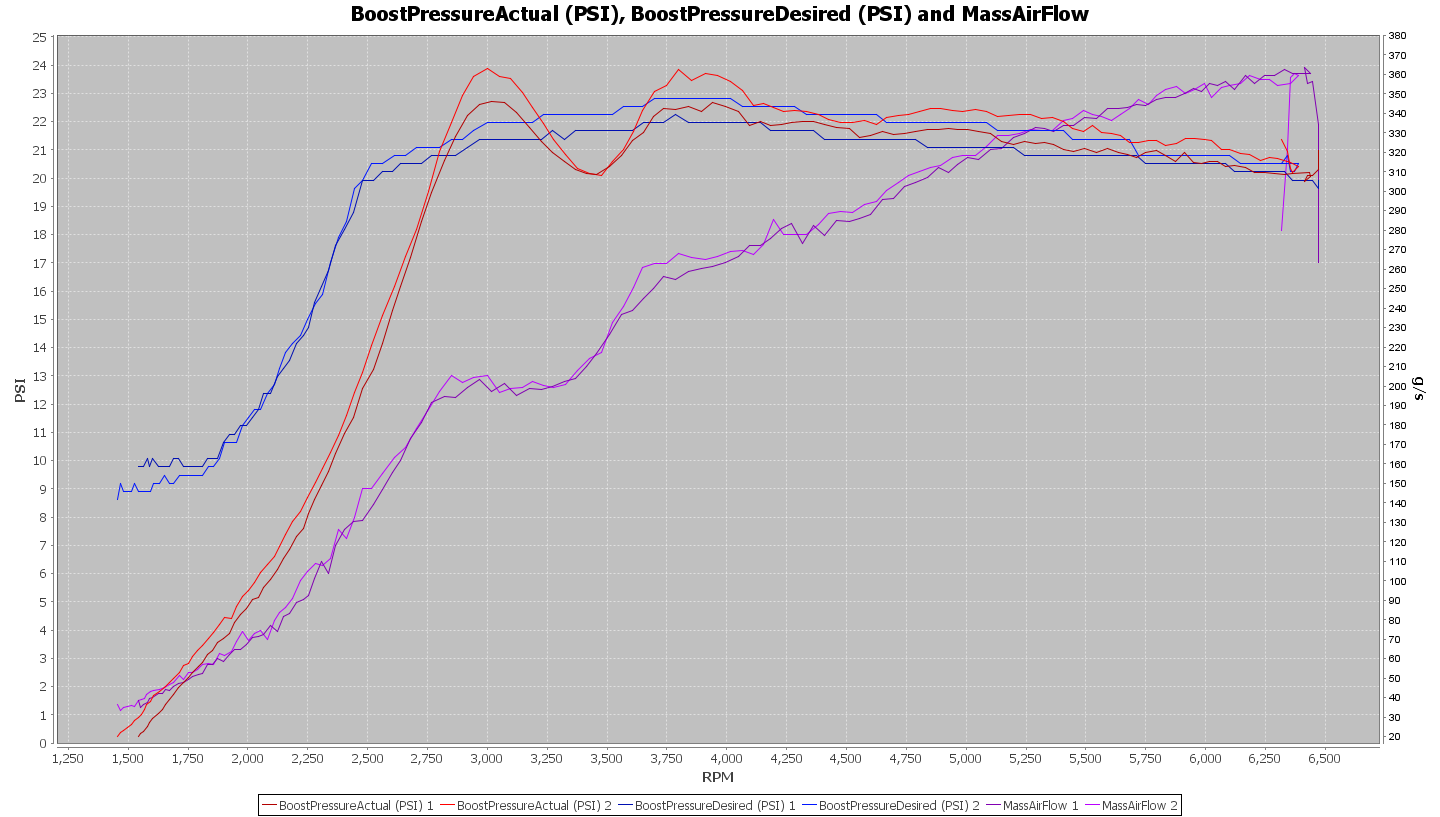
Boost and MAF
Boost & MAF
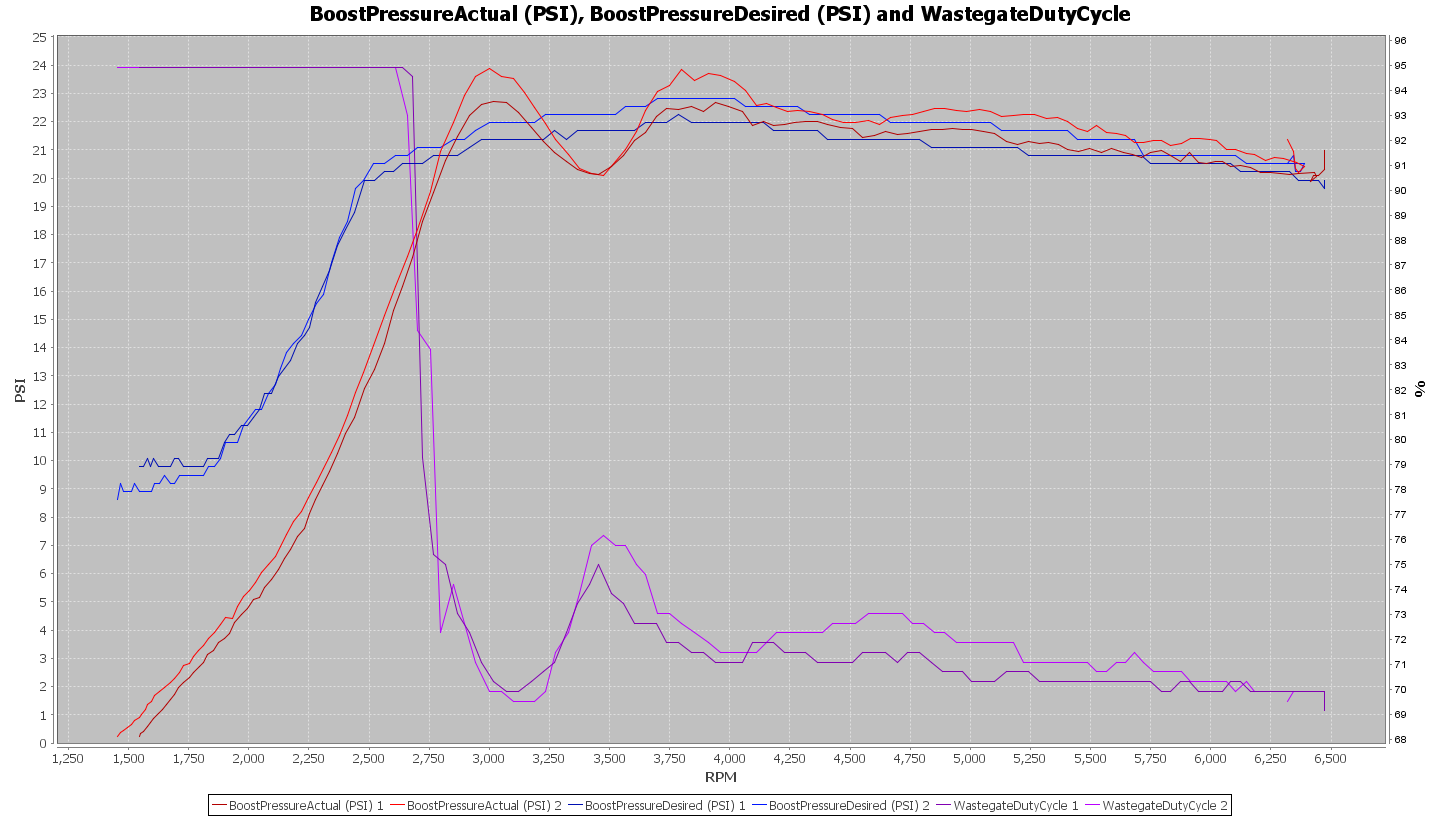
Boost and N75 Duty Cycle
Boost & N75DC
Note: The PID was calibrated for loads experienced on the street since tuning was not done on a dyno. The load presented by the Dynojet differed from that on the street. The boost / torque oscillations seen on the dyno are not replicated on the street.
Here is how the K04’s compare with K03 turbochargers on my car. K03’s are shown with two different tunes, one very aggressive and the other moderately aggressive.
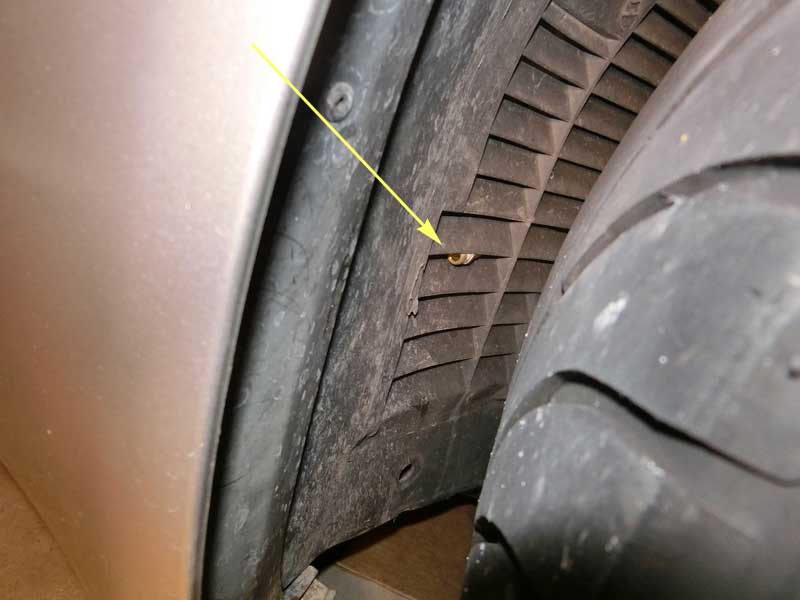
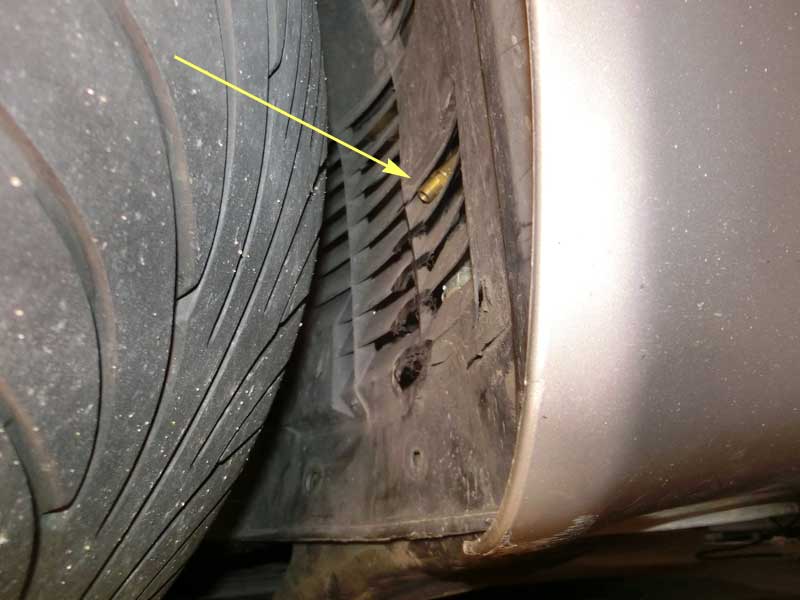
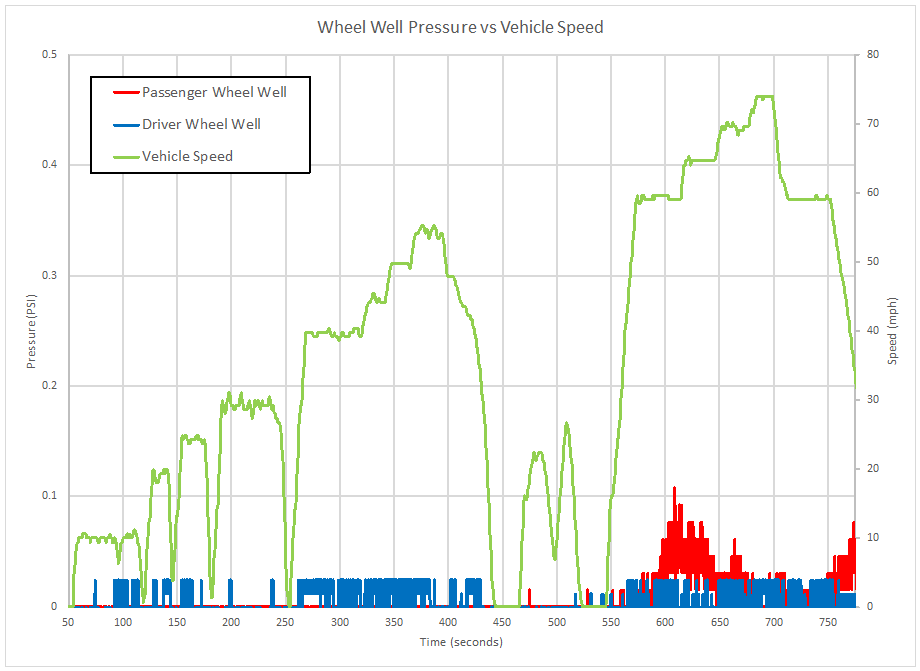
While in the process of removing the shroud from my test intercooler I realized it would not take much additional effort to relocate a couple of pressure sensors to the wheels wells to check a claim that there is a high pressure region in front of the tire that hurts air flow through the intercooler core.
Shown below are the locations that the sensors were placed in the wheel well liner slats.
Driver side wheel well linerPassenger side wheel well liner
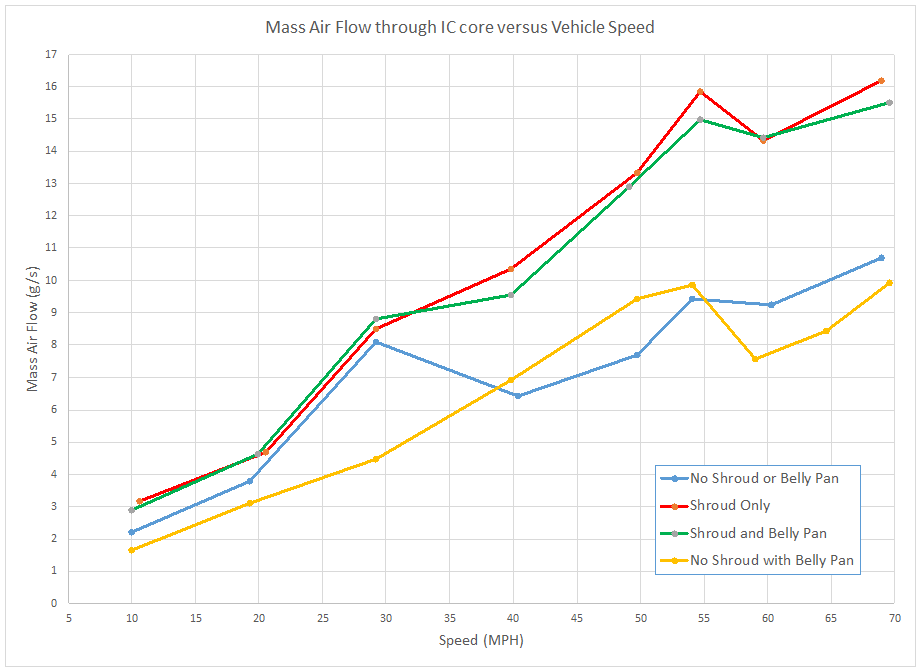
After placing the sensors in the wheel wells I set out on the same route I have driven previously for the IC shroud testing to collect IC MAF data.
Results:
Shown below is the pressure reading from each sensor during the drive.
Effectively there was no positive pressure recorded by either sensor. The values shown on the chart (red and blue lines) are within the sensors measurement error. Possibly a more sensitive device, one that could accurately read less than 1/10 psi of pressure, could have shown a change with different speeds.
The one period where the passenger side pressure rose to approximately 0.05 psi may have coincided with the S4 passing another vehicle resulting in a momentary increase in pressure.
The other results that were obtained are related to the mass air flow through the intercooler core. This case had the shroud removed from the intercooler and the belly pan in place.
Overall the results of this testing have produced some peculiar trends that suggest there are some not-so-obvious air flow interactions taking place through the bumper cover and below the vehicle.