Over the weekend I received a shipment of BMW N54 engine turbocharger inlet pipes for flow bench testing. I’ve tested a couple other sets of these inlet pipes in the past and I was interested to see how another take on these parts would perform.
This set was supplied by FrankenTurbo, the same vendor that had shipped the stock BMW inlets to me several months ago for flow testing.
Here are a couple pictures of these FrankenTurbo inlets on the flow bench:
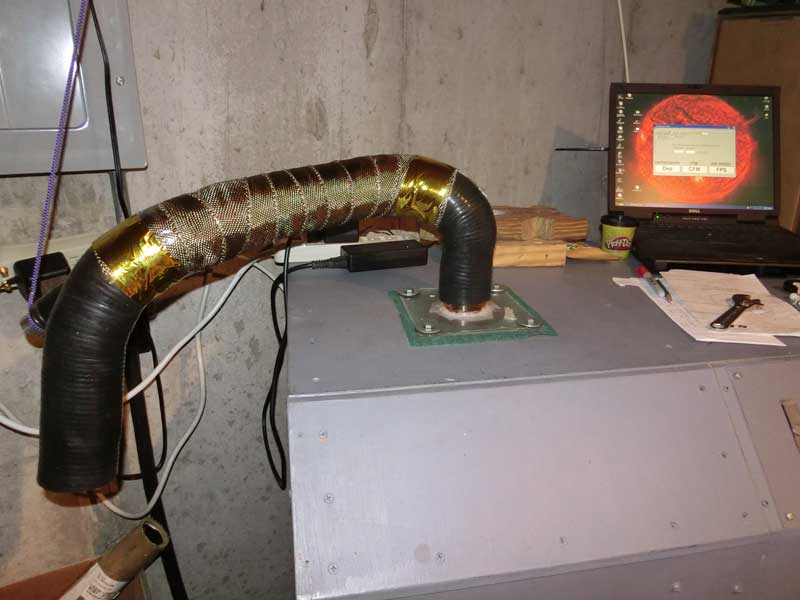
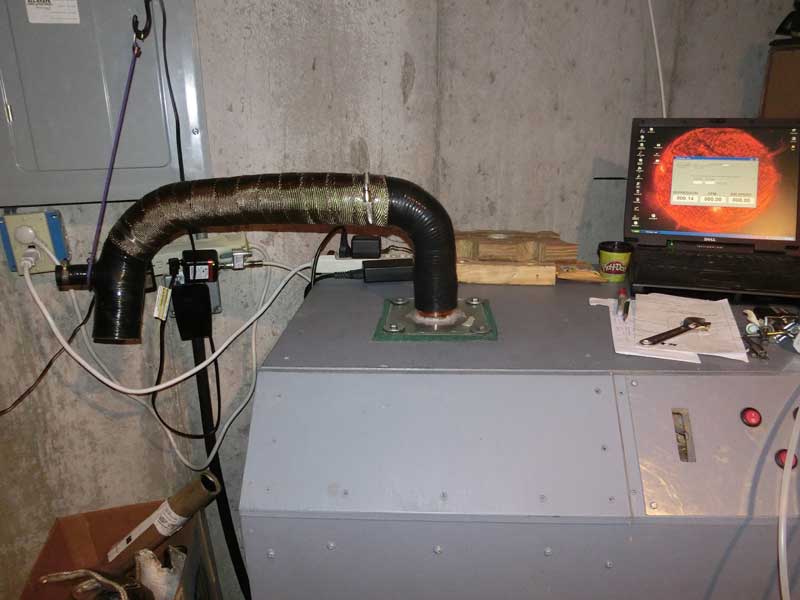
The test was performed similar to how I did in the past, affixing the inlet to the flow bench and drawing air into the pipe.
Inlet Flow Results:
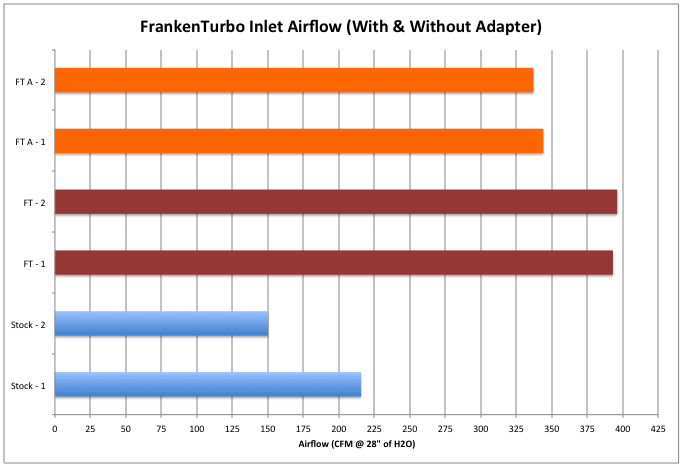
The chart below is a compilation of all of the BMW turbo inlets that I have flow tested.
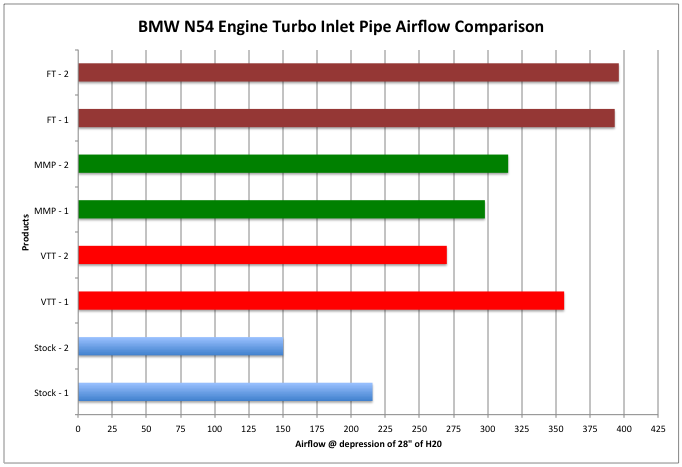
In a departure from the presentation that I used in the past I am limiting the chart to airflow readings that occurred at a test depression of 28″ of H20.
There are two reasons for this; firstly 28″ of H20 is a commonly used test point for flow bench airflow tests.
The second reason is that the chart I produced previously included extrapolated data, going out to test depressions two to three times what I recorded on the bench. Estimating out that far introduces errors, which are magnified the further one extrapolates. To better assess how the products compare, I am limiting the results to the range that the flow bench can directly measure.
Something else to point out, I am not familiar with how these pipes attach to the N54 engine, so the labeling scheme that I used may be incorrect. That is, I have labeled one pipe number one and the other number two. I’m not sure that this is the proper naming convention for all of the products, in some cases I may have mislabeled pipe two as pipe one. Keep that in mind as you review the chart data and compare airflow readings between the pipes.
Here’s an additional chart showing the FrankenTurbo inlets with the adapters added for coupling them to the turbochargers. Airflow decreases with the addition of the adpaters.