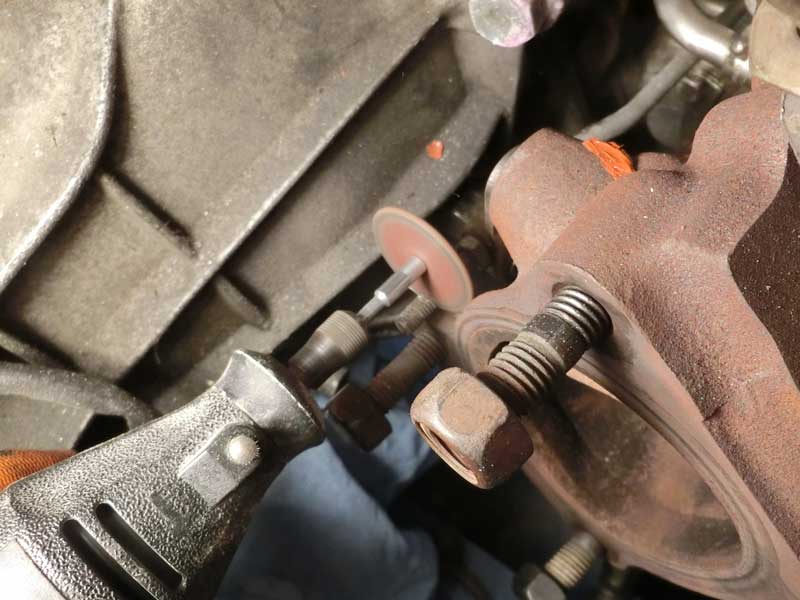
Before I begin the reinstallation of the Nogaro’s engine I want to ensure the turbocharger wastegates are set to an appropriate preload level. The first thing I noticed was that with an acceptable preload the end of the wastegate arm was going to extend a bit further than I cared for.
I took a Dremel cutoff wheel to the wastegate arms to trim both down a little.
I found that the Nogaro had shown up with the preload set to approximately 2 psi, on a K04 turbo that’s low. I upped the preload to approximately 6 psi which is closer to what the BW K04’s come set at.
Later I undertook one of my least favorite routine maintenance activities, replacing the fuel filter. By the looks of things this Nogaro made it to 90k miles for its first fuel filter change.
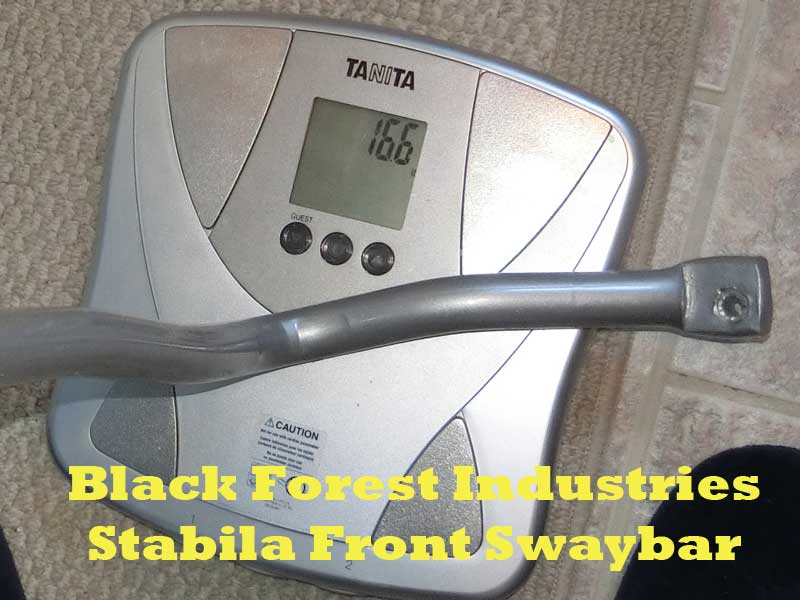
Today I decided to tackle installing the front swaybar on the Nogaro project S4.
The car came with NO swaybars, except a Black Forest Industries Stabila upgraded front swaybar in the trunk. Lacking a rear swaybar I’ve not been inclined to put a higher than stock rate bar on the front of the car.
I did put the Stabila on the scale to check the weight – 16.6 lbs. I also measured the diameter of the bar – 29 mm.
BFI Stabila FSB
I have not yet measured the OEM S4 front sway bar, but I have read from others that the diameter is the same and weight is also the same as what I recorded for the BFI Stabila. I need to inquire with BFI about how much greater the rate of this bar is.
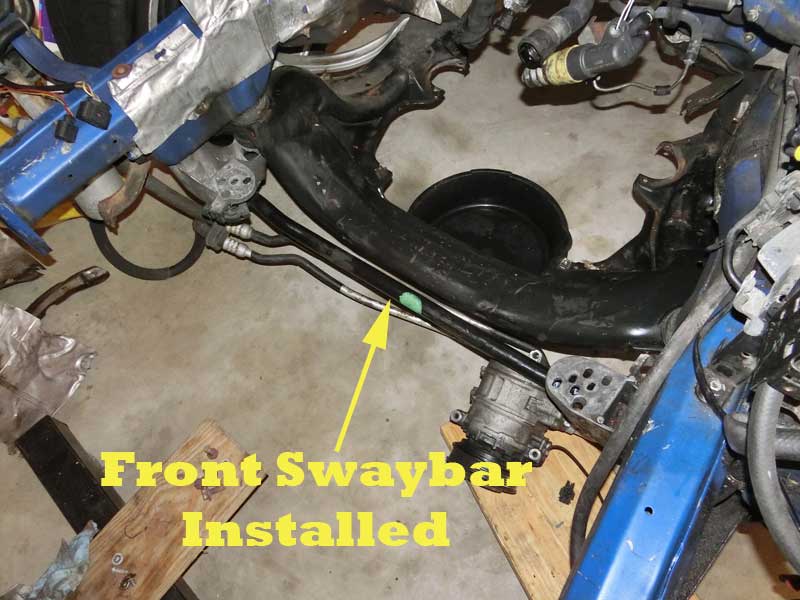
OEM Front Sway Bar Installed
I took a used front sway bar that I had and installed it onto the Nogaro car.
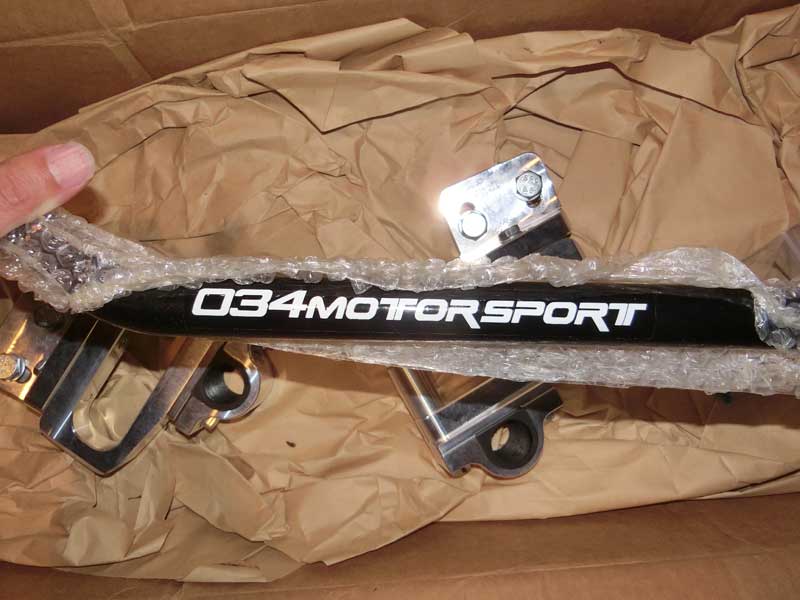
034Motorsport Solid Rear Sway Bar
I’ve decided the 034Motorsport Solid Rear Bar that I’ve had in storage for a while will go to a new home, I’m selling it, not installing it on the Nogaro. The Nogaro will receive a stock B5 S4 rear sway bar.
I may try an upgraded rear bar, but with the STāSIS Öhlins Motorsport Suspension on my Silver S4 I’m guessing the 034 RSB will be overkill if I were to use it on that car.
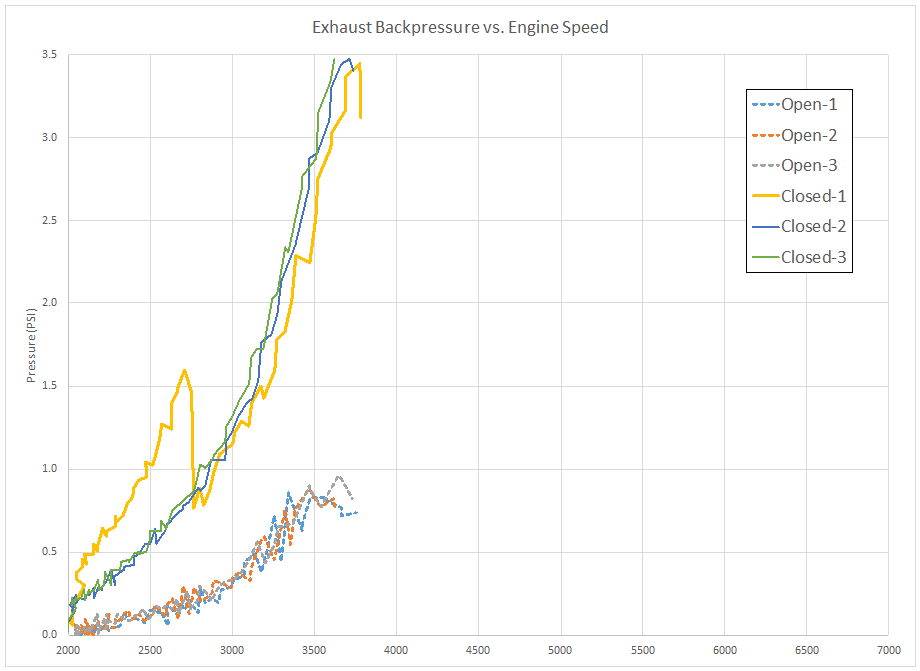
Interest in demonstrating a relationship between exhaust system back pressure and boost onset led me to run a test where I measured each while applying a covering over the exhaust pipe outlet.
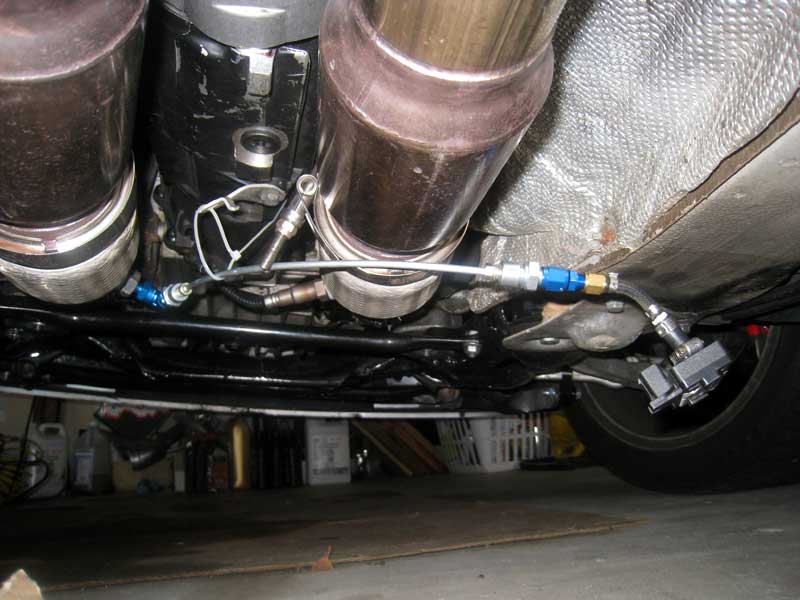
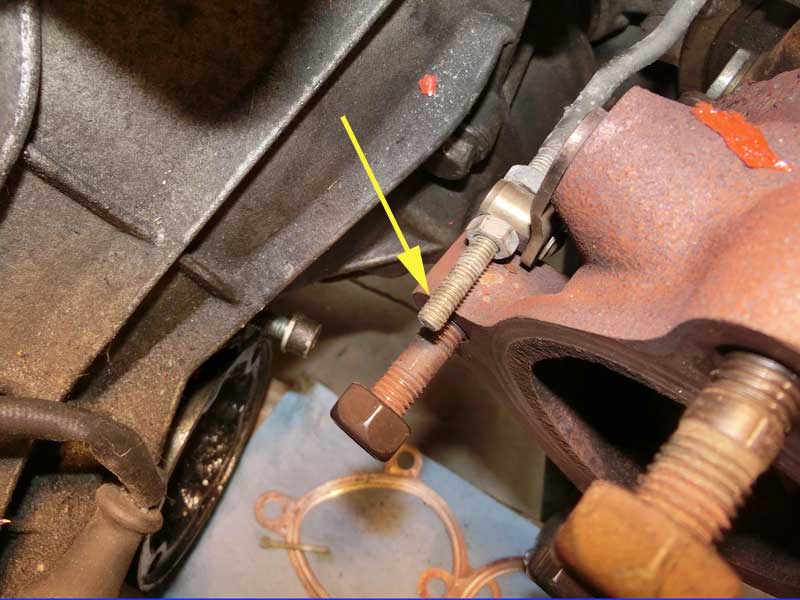
The stock MAP sensor was used to record Intake Manifold pressure and a 4 BAR sensor was connected to a fitting that reads exhaust pipe pressure at the secondary O2 sensor bung, which on my car is located in the downpipe prior to the catalytic converter. The setup for reading the exhaust pressure is similar to what is shown above, though the picture was from a prior configuration, that I have since economized a bit so as not to be hanging down like the picture shows.
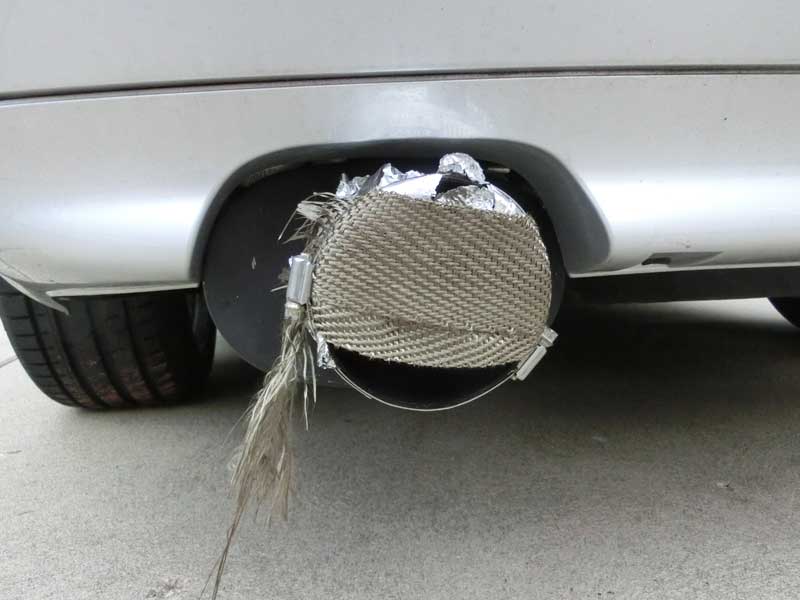
The cover consisted of a piece of heavy duty aluminum foil doubled over and then a piece of DEI exhaust wrap placed on top of the foil to create the seal with some reinforcement.
I took readings under three conditions; first with the exhaust pipe open as it would normally be, second with the cover obstructing approximately half of the exhaust pipe exit, and last with the exhaust approximately 80% blocked off.
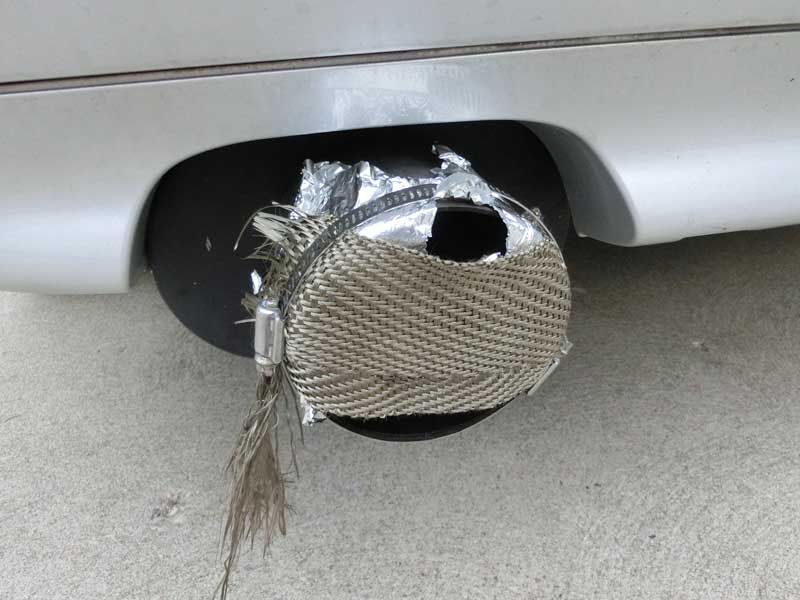
As the above ‘after’ photos show, the coverage of the DEI wrap was not complete, and there was sufficient pressure build up in the exhaust to rupture the foil cover where it was not reinforced.
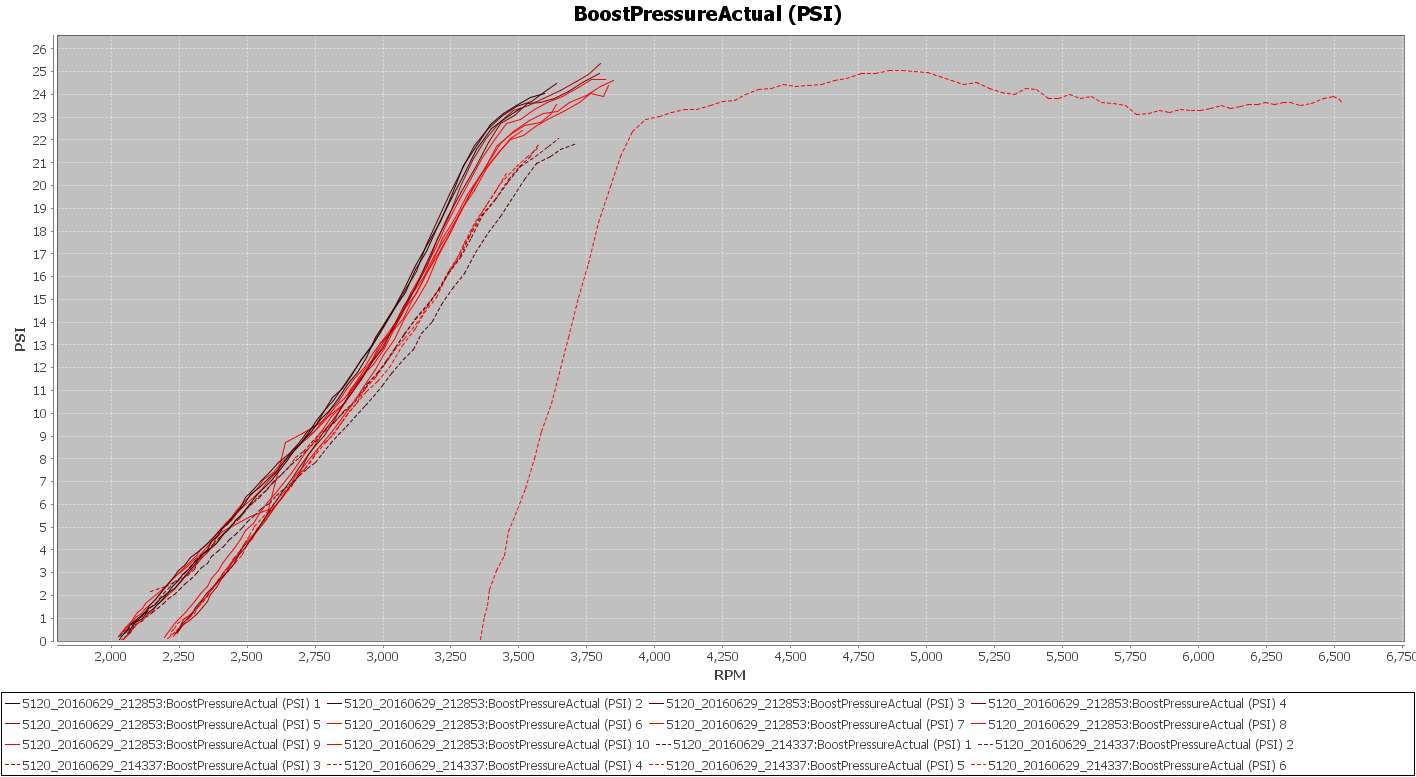
The occurrence of the ‘blow-out’ is clearly indicated in the exhaust back pressure chart (below) that compares the fully open to 80% covered conditions. The rising pressure suddenly drops quickly, then continues rising as engine speed increases.
Starting engine speed was 2000 rpm for three sets of measurements and then approximately 2200 rpm was recorded two times. The intent being to see how boost onset was affected when starting at a higher airflow rate.
TTE550 Boost Rise (70 degF ambient)
Shown above is the boost onset for the six different cases. The solid dark lines are the first series where the exhaust was open. The solid red lines are with the exhaust half covered, and the dashed lines are with the exhaust exit 80% covered. The trend is for the boost onset to slow as the exhaust exit becomes increasingly covered.
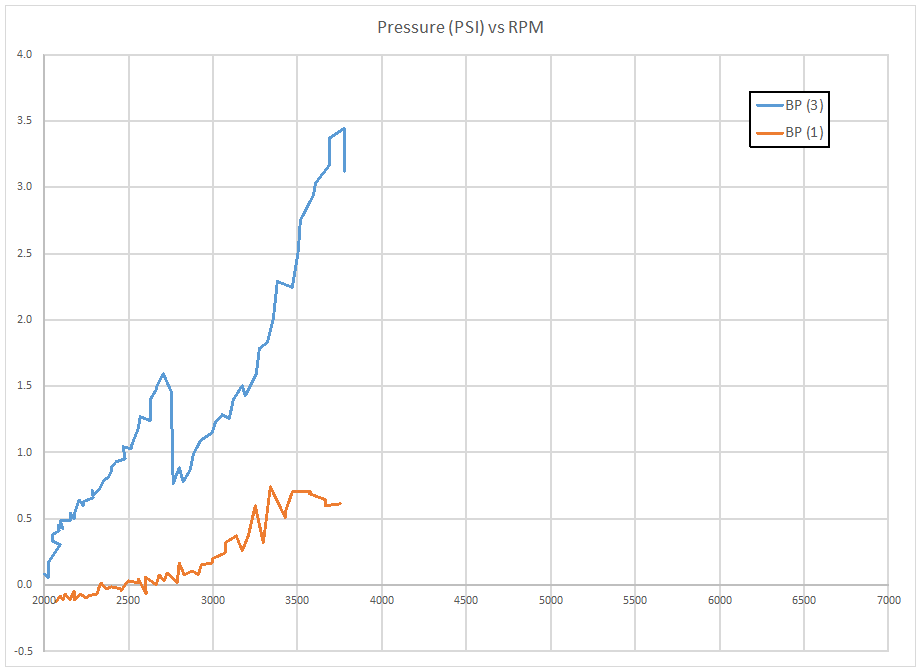
Shown above is the first data series for the two extreme cases, with the exhaust unobstructed represented with the orange line, and the exhaust 80% obstructed represented by the blue line. The hole forming in the foil takes places around 2750 rpm of the first pull.
Case 1 vs Case 3 Exhaust System Backpressure
Above is the the same exhaust back-pressure data with the addition of the second and third 2000 rpm starting engine speed pulls.
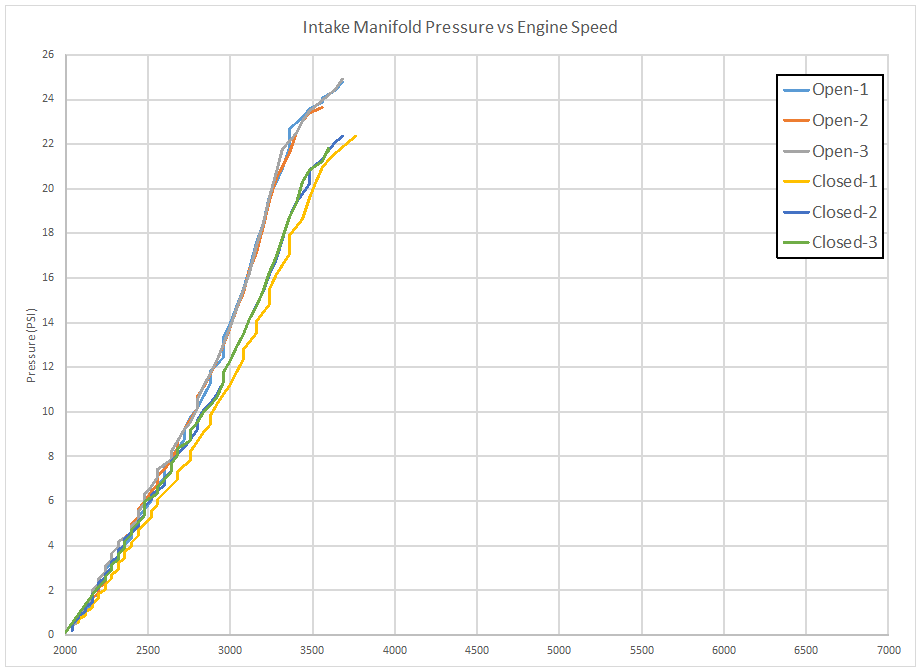
Intake Manifold Boost Onset
Finally, shown above is the Intake Manifold Pressure for the two extreme test cases.
Conclusions:
It is apparent that blocking off the exhaust will increase the back pressure in the exhaust system, and the increasing back-pressure causes boost onset to be slowed.
What is unclear is how representative the worst case test may be of alternative exhaust systems. Without putting different exhaust systems on the car to record the back-pressure that they generate I cannot speculate as to how much back-pressure exists in other systems.
 I found that the Nogaro had shown up with the preload set to approximately 2 psi, on a K04 turbo that’s low. I upped the preload to approximately 6 psi which is closer to what the BW K04’s come set at.