The information collected by the B5 S4 survivor poll provides some material to make a few swag’s. One question I was interested in exploring is “how many more years will the North American supply of roadworthy B5 S4’s last?”
To formulate an answer requires making some significant assumptions, but weighed against the alternative, a completely uniformed guess, the assumptions seem like a fair risk to assume.
Step 1. Based upon the survey results the percentage of 2000 model year S4’s, as a percentage of the total number of S4’s produced, has dropped from 45% to 29%. If this 29% is multiplied by the total production numbers, 12510, there should still be 3,632 model year 2000 S4’s out there.
Step 2. Subtracting the remaining 2000 S4’s from the initial MY2000 number, 5672, gives 2040 lost vehicles. Over a 16 year period this averages out to being 128 MY2000 S4’s have been lost per year.
Step 3. If the same loss rate is applied to the model year 2001 and 2002 vehicles, over a 15 year time period, the number of non-2000 model year vehicles lost is 1913. The number remaining is then the original 5998 2001’s plus 840 2002’s, minus the 1913 lost vehicles, leaves 4925 remaining non-2000MY S4’s.
Step 4. Adding the remaining MY2000 to the remaining MY2001 and MY2002 cars gives a total remaining number of 8557 S4’s still out there.
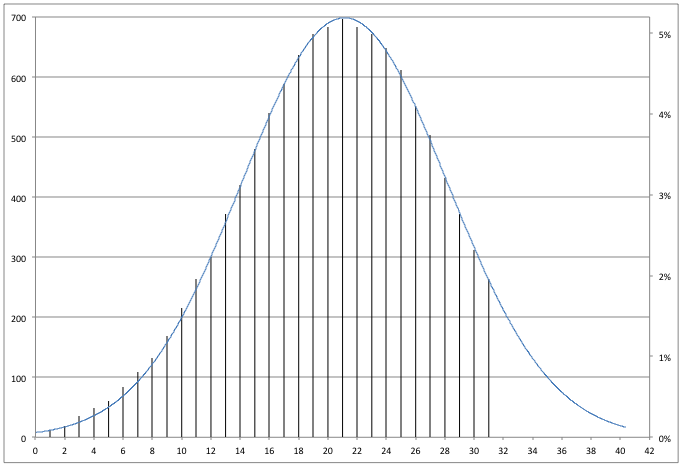
Step 5. Making an assumption about the annual loss rate, that it follows a Normal distribution curve.
The rationale for this is that early in the vehicle lifecycle it was relatively expensive. This has several consequences, first that owners will be more likely to take better care of the vehicles. Second that the higher cost to acquire the vehicle will mean the demographic that can afford it are in a higher economic range and likely more mature than the general population, thus they will drive more responsibly and be less likely to have an accident. Third, the higher value of the vehicle means if it incurs minor damage it is more likely to be repaired by an insurance company.
As the vehicle ages and drops in value the annual loss rate rises for reasons similar to those already given. A low-cost vehicle will not be cared for as well. Purchasers who are inexperienced drivers now have access to the car. The low-cost means that minor damage could lead to totaling the vehicle. The parts on the vehicle have become more valuable as a collection, rather than the vehicle as an operable automobile. Parting a car, and making it not roadworthy, becomes more lucrative than selling it whole. It is during this time that the annual loss rate rises.
Finally, there will come a point when the annual attrition of a fixed inventory will leave few vehicles roadworthy. It is at this point that the vehicle may become valuable once more. It may still be owned by people who take care of it, and the others that are sold MAY begin to demand a premium, which will once again put it out of reach of many of the inexperienced operators. Consequently the attrition rate begins to slow again.
With this as the justification for using the Normal distribution, and estimating that in 2016 the number of remaining vehicles is approximately 8557, what yearly attrition rates fit the curve such that in year 16 the calculated number of remaining vehicles would be around 8557? These are the numbers on the lefthand vertical axis.
The B5 S4 has still not reached the maximum attrition rate, which should be reached in about 5 years. At which time there will be approximately 5,976 B5 S4’s still roadworthy in North America.
In 10 years, as the attrition rate is dropping, the number still on the road will be around 2,808
Four years after that, 14 years from now, the number of roadworthy B5 S4’s is expected to be one-tenth of the original North American supply, only about 1,188 S4’s left.
As was stated at the start, there are some significant assumptions being made to generate these projections, but then the alternative is to simply guess.