A question was posed to me about how the turbocharger boost onset data might look if the range being compared was expanded from 2 to 11 psi to go from 1 psi up to 20 psi. The 20 psi top end results in the BW K03 data being lost on account of the boost profile that I used with the K03’s stopping short of 20 psi of boost.
For the remainder of the turbochargers the data that I have collected produces the following results with a 1-20 psi range.
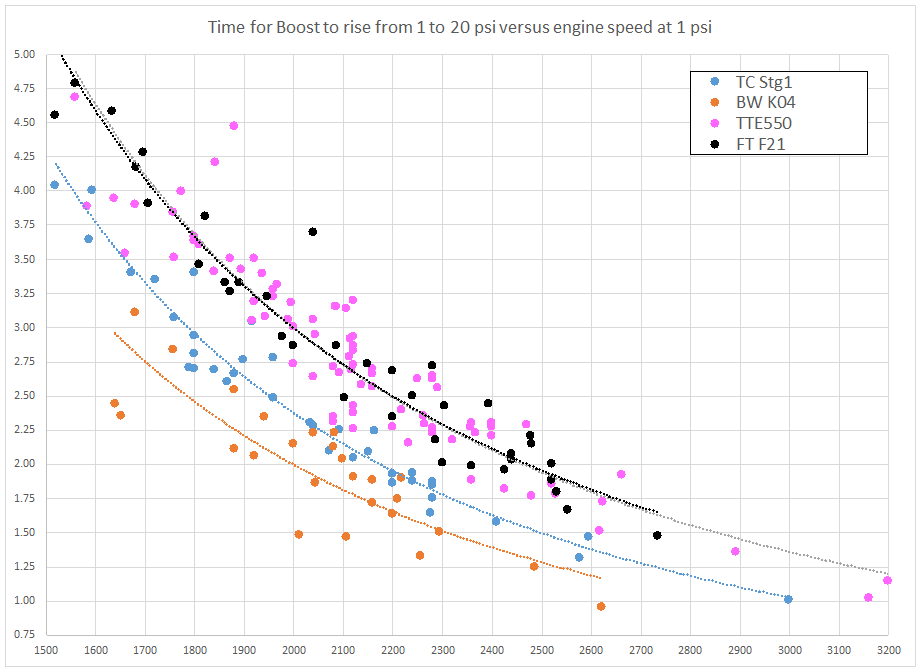
1 to 20 psi Boost onset times
The general trend is similar to before, although the FrankenTurbo F21 and TTE550 are now harder to distinguish differences between. The differences between these two products now appear smaller than with the 2-11 chart, below.
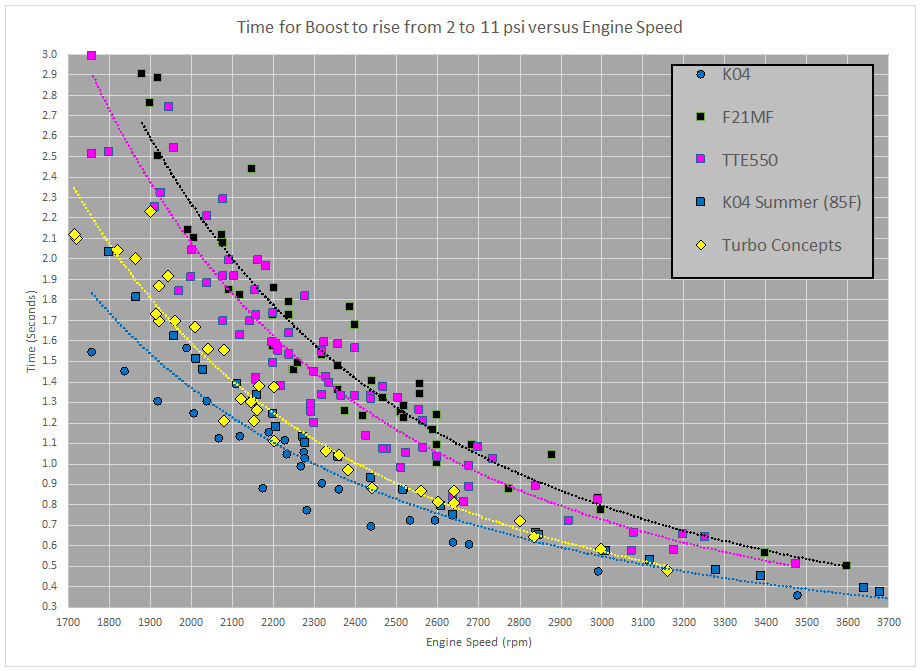
Turbo Concepts 2-11 times
Subjectively I feel that the 2-11 chart captures the differences in feel from the driver’s seat better, but in terms of practical differences the data on the 1-20 chart suggests that at least in one comparison the differences may be less than those I have perceived.
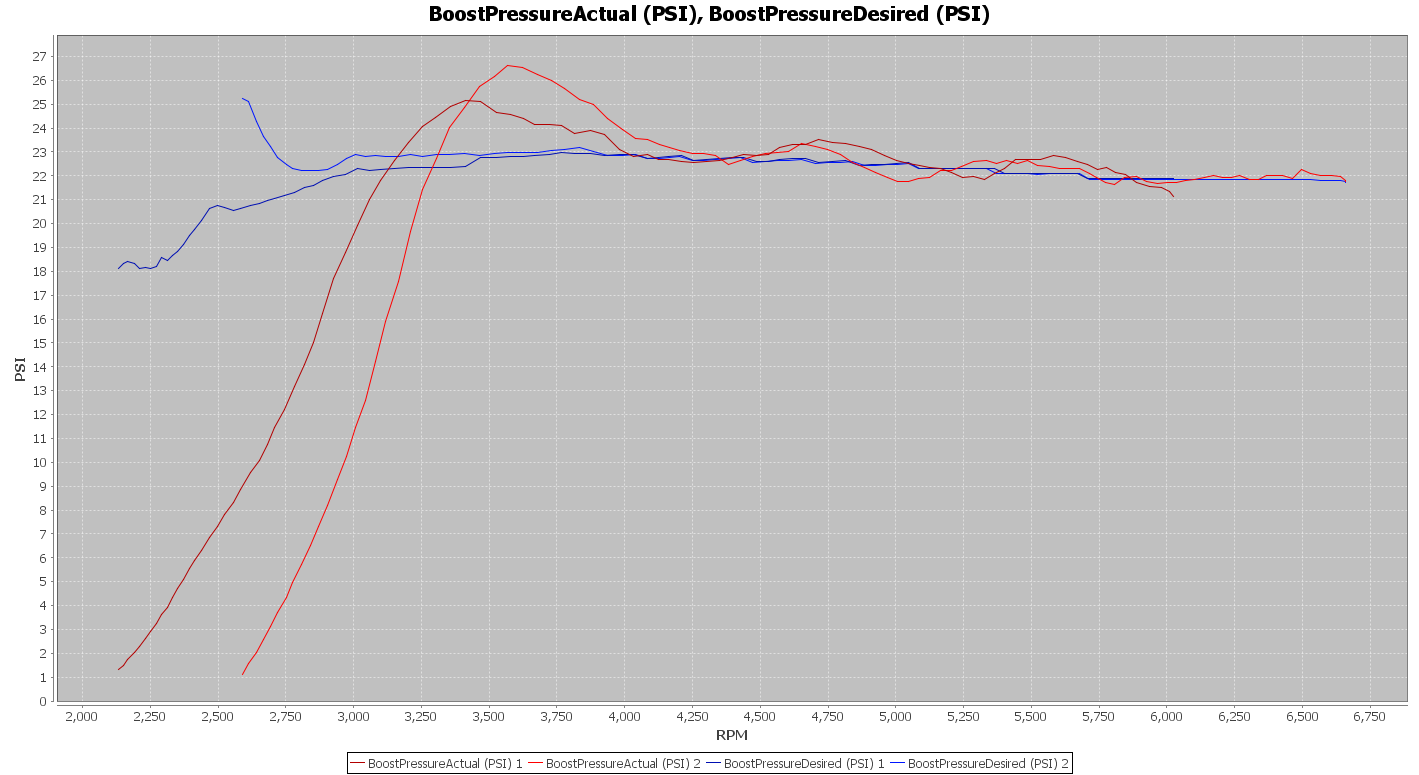
I’m continuing to work on replicating the boost profile that the car operated at with the BorgWarner K04’s. In this effort I am mainly concerned with the top end boost so that I can compare the pre-turbine backpressure produced by the Turbo Concepts Stage 1 turbochargers with that from the other logged turbo’s. The current state of the boost profile is shown below:
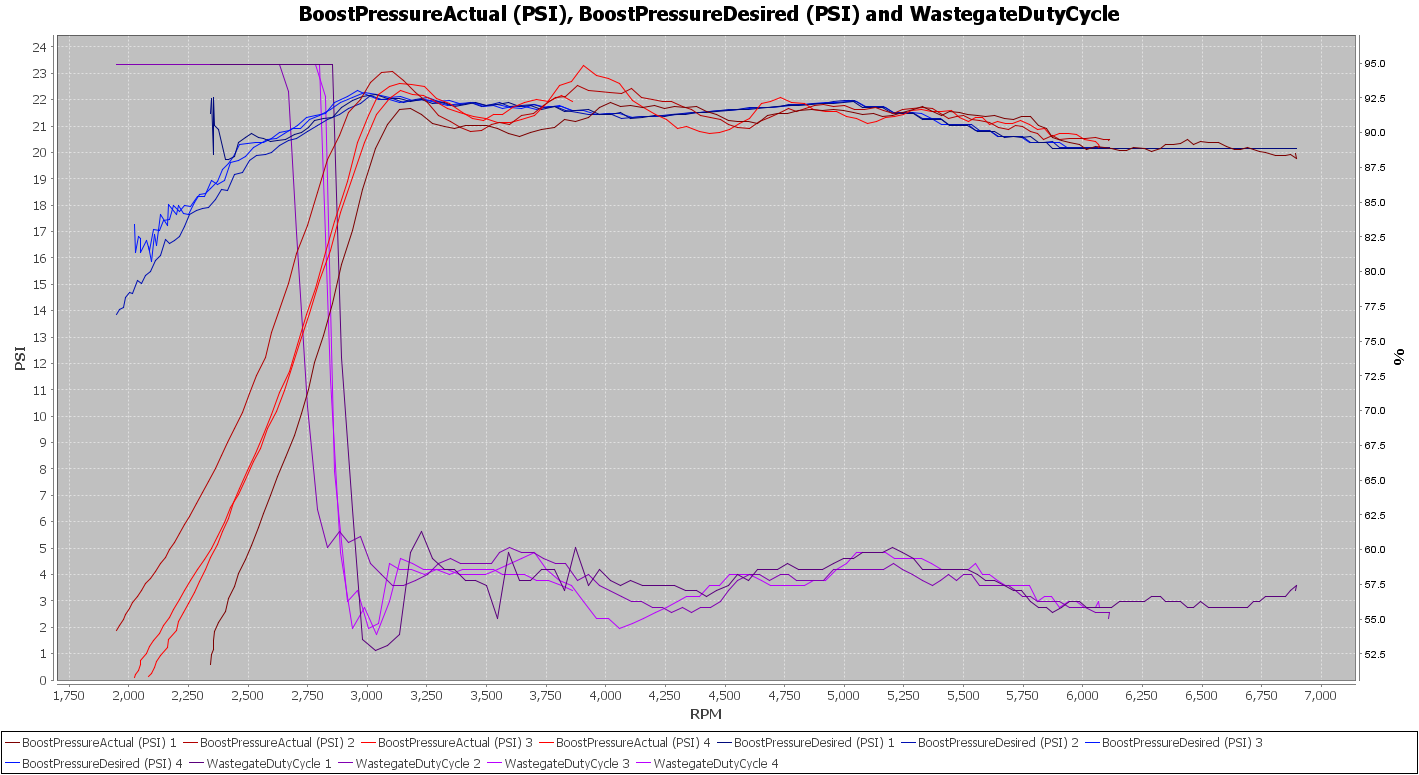
Turbo Concepts Stage 1 Turbos Boost
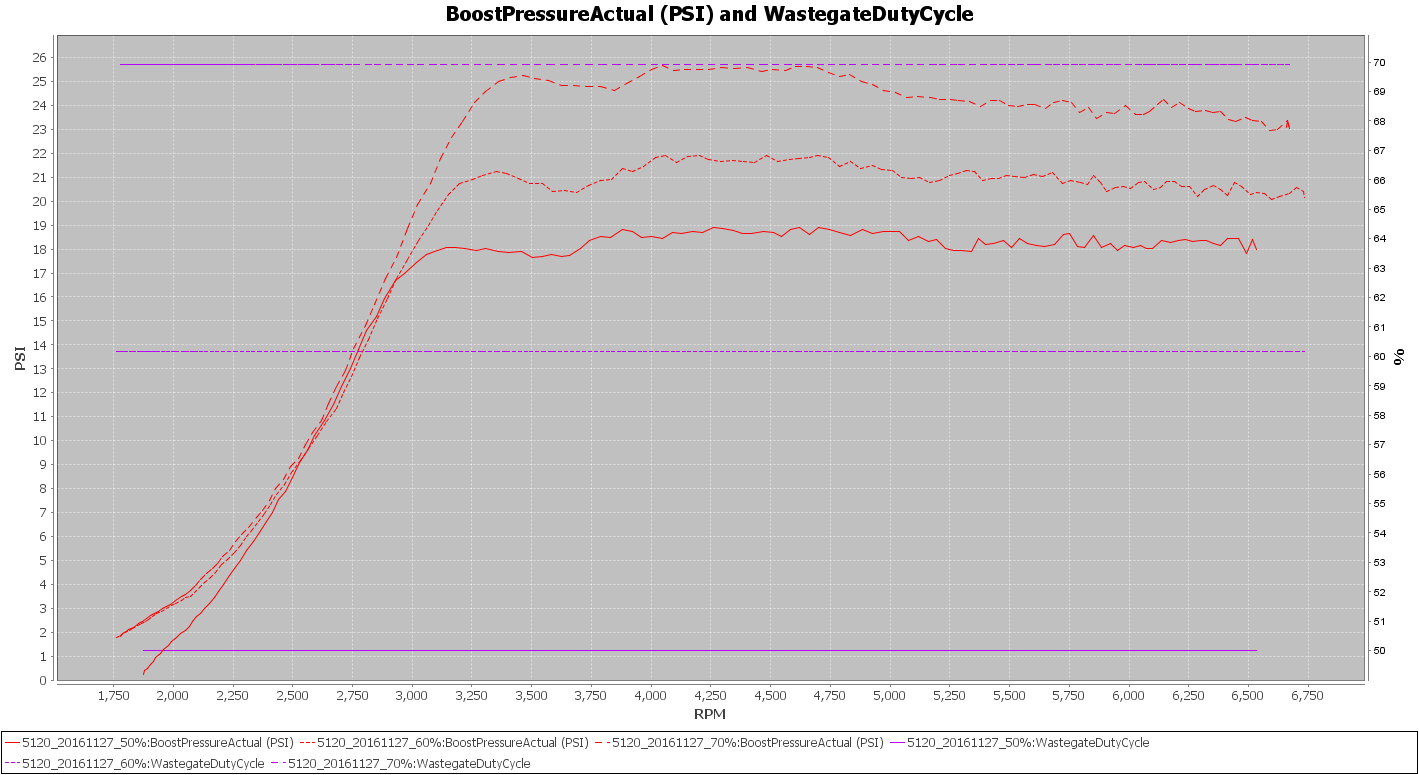
This tune started from a FrankenTurbo F21 tune that I used with the same hardware, aside from the turbochargers. The wastegates on the Turbo Concepts turbochargers are set about 1.5 psi less than what the FT’s had, so I was anticipating some adjustments needing to be made. The first few revisions were not generating the results I was wanting, so I went back and logged the boost developed at a variety of fixed wastegate duty cycles. A sample of some of these are shown below:
I suspect one of the reasons this effort to modify the tune is proving a bit more of a challenge than I had anticipated is on account of the unsteady boost curve. I’d have expected a fixed WGDC to produce a straighter line. I was concerned with the wastegates when I was trying to set the pre-load and was having trouble, the variations shown above further my concern about the wastegates on these turbochargers.
Continuing to collect data from the Turbo Concepts Stage 1 turbochargers as the tune is being tweaked some more.
Turbo Concepts Stage 1 Turbo Boost
The recommended boost I’ve been advised to operate these turbochargers at is an initial rise to 18-20 psi and then taper to 12 psi, aiming to have boost at 15 psi by 5000 rpm.
Unfortunately a boost profile such as that would preclude me from collecting good comparison data to use for evaluating the Turbo Concepts turbo’s against the BW K04’s and other turbochargers that I’ve already evaluated. My plan is to operate with a boost profile closer to that of the BW K04’s, climbing to 22-23 psi and then tapering down to 21-22 psi. Once I’ve been able to collect the data that I need I will look into tuning to the recommended boost profile for these turbo’s.
Here’s some additional data from the Turbo Concepts.
Turbo Concepts 2-11 times
With a trend line now on the chart the general chartacter of these turbo’s, with respect to boost onset, can be seen. The Turbo Concepts Stage 1 turbo is not far off from the BW K04, though all of the data collected thus far has been in cool conditions, whereas most of the other turbochargers were logged under a wider range of ambient temperatures.