It was a little over 18 months ago when I was trying to determine what affect a turbocharger blanket would have on spool up that I defined a measurement called the 2-11 time. The initial discussion of this measurement centered on how I determined what the measurement would be of, but not why I thought this measurement was useful for comparing the responsiveness of different turbochargers.
Recent discussion about the measurement has given rise to some questions that provide a good opportunity to look more closely at the 2-11 time and consider if there are alternative measurements that may be better at expressing the turbocharger response characteristic it tries to represent.
One of the first questions was “why not measure vehicle acceleration? ” Fair enough. When I asked how the data should be presented it was suggested to use rpm vs time, as a line graph.
Here’s a sample of how this would look for the first couple of seconds of a few pulls:
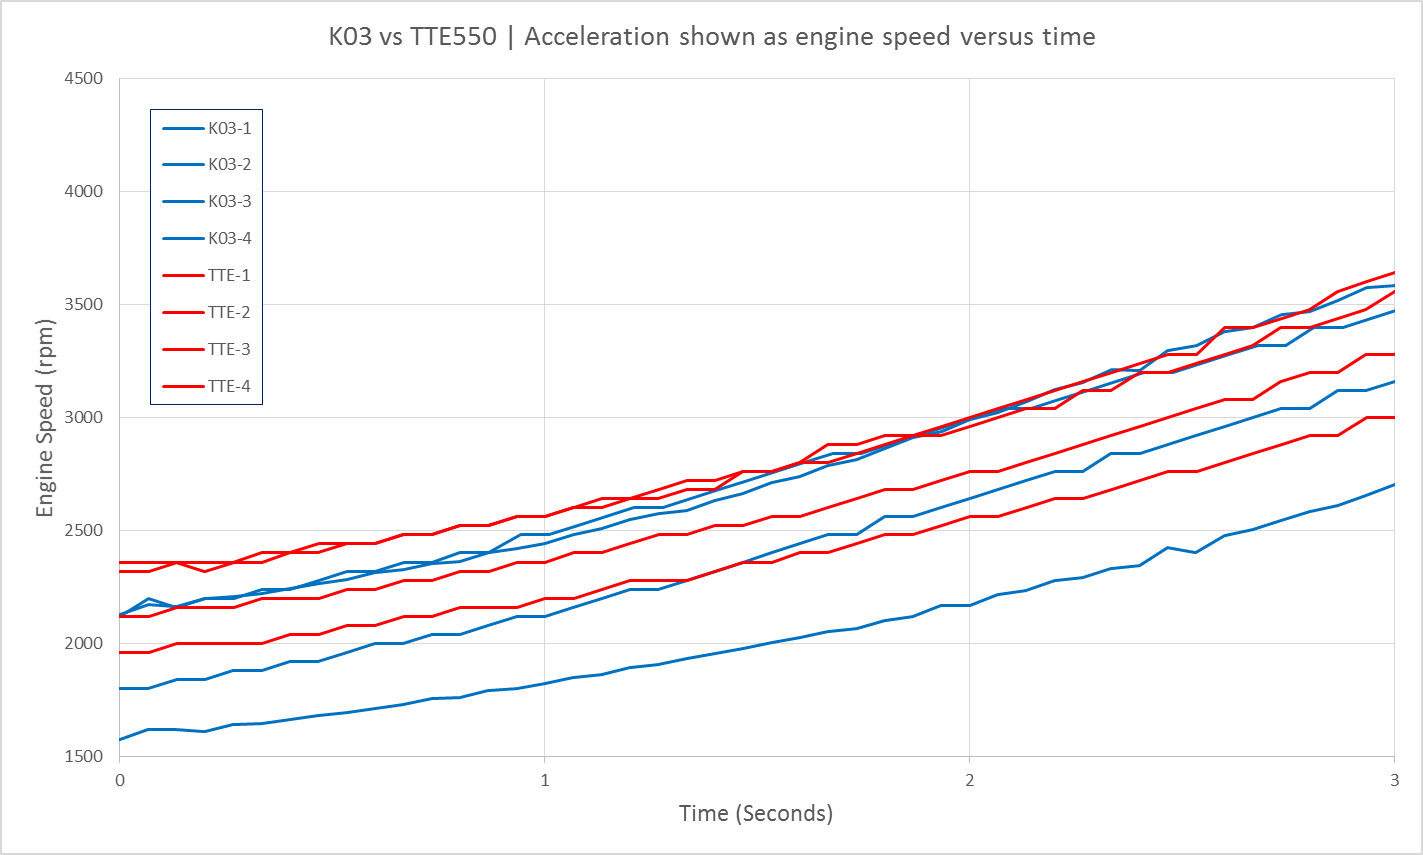
This to me is not particularly clear, at least not with respect to which setup is more responsive. Putting these pulls into the format I’ve chosen, the data for these two turbochargers looks like what is shown below:
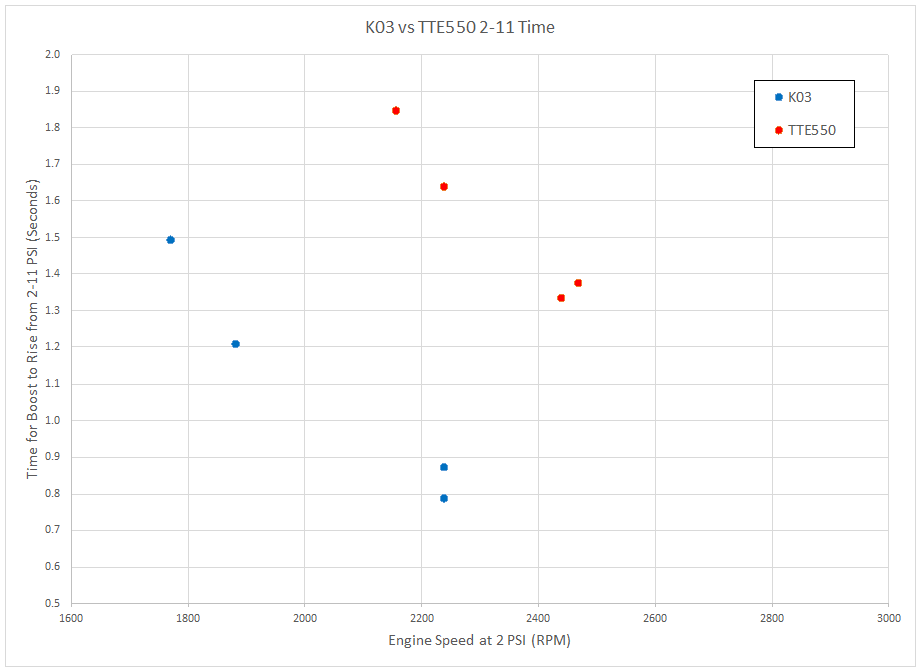
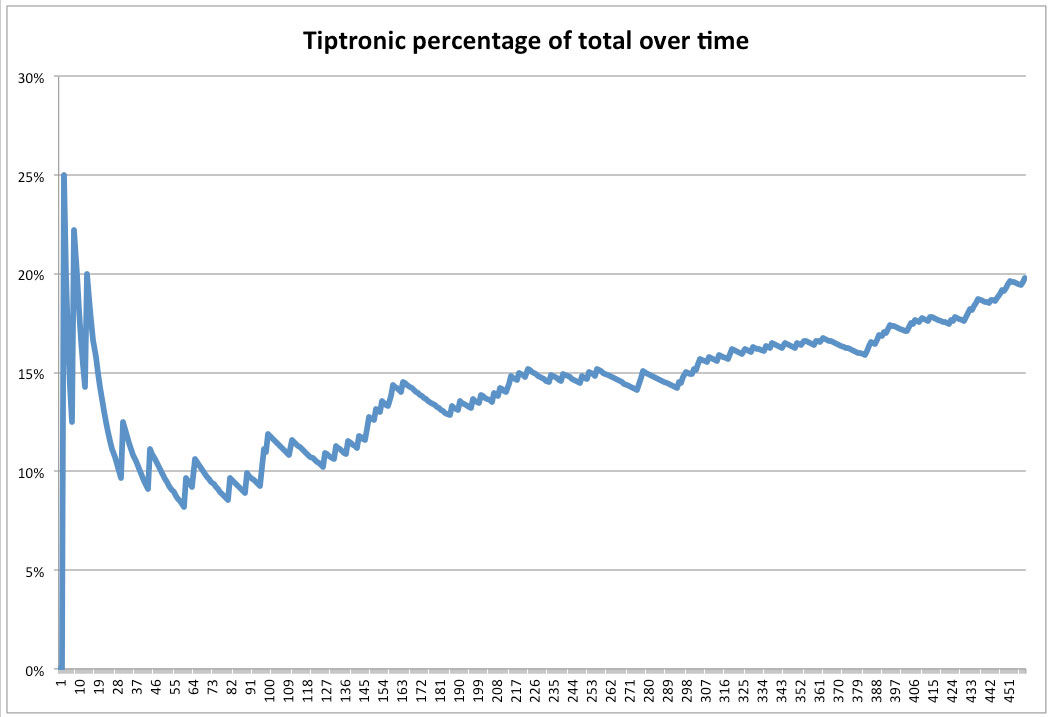
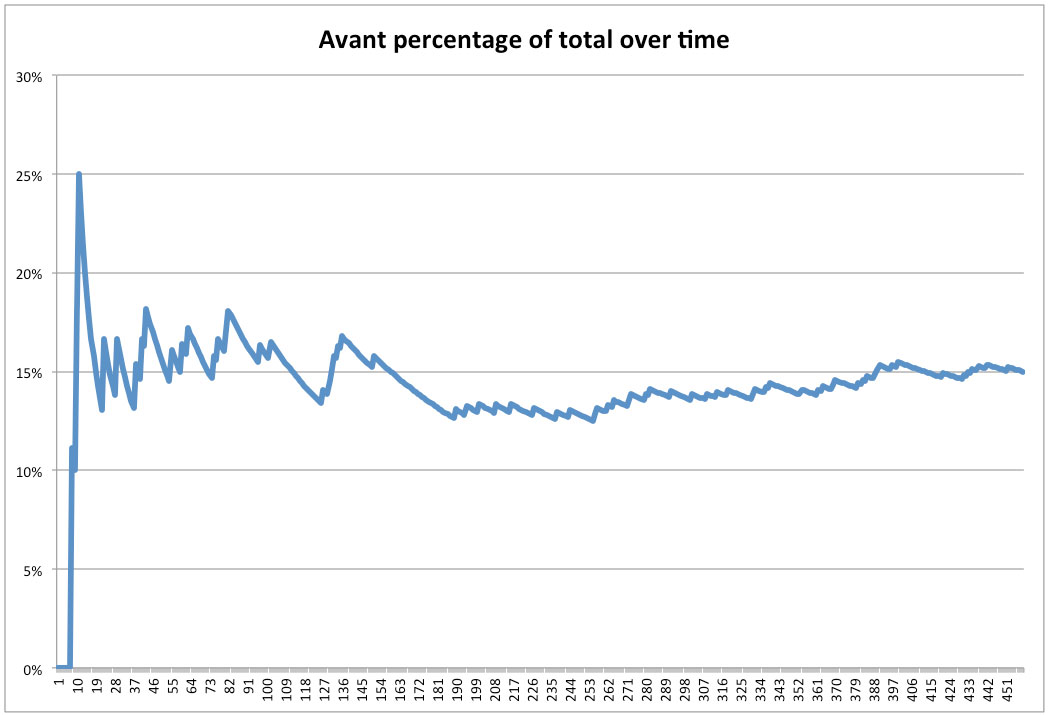
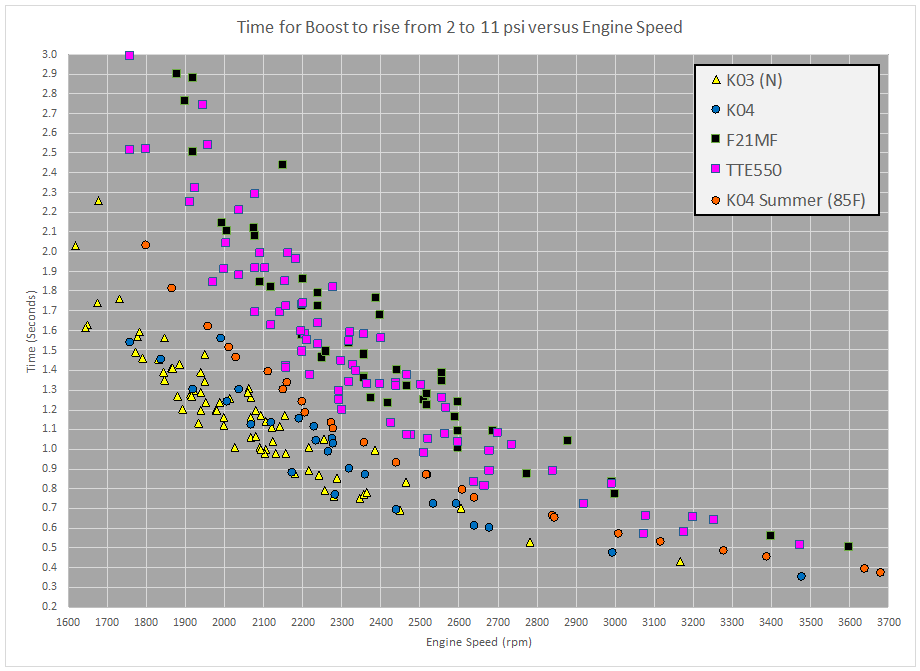
Another advantage is the amount of data that can be represented while still being able to differentiate between the products. The chart below has 255 pulls shown, if I were to try and put that many acceleration curves on a chart with lines it would be incomprehensible.
Some other comments made were as follows:
“Boost pressure is not spool.”
True. But looking at a compressor map,
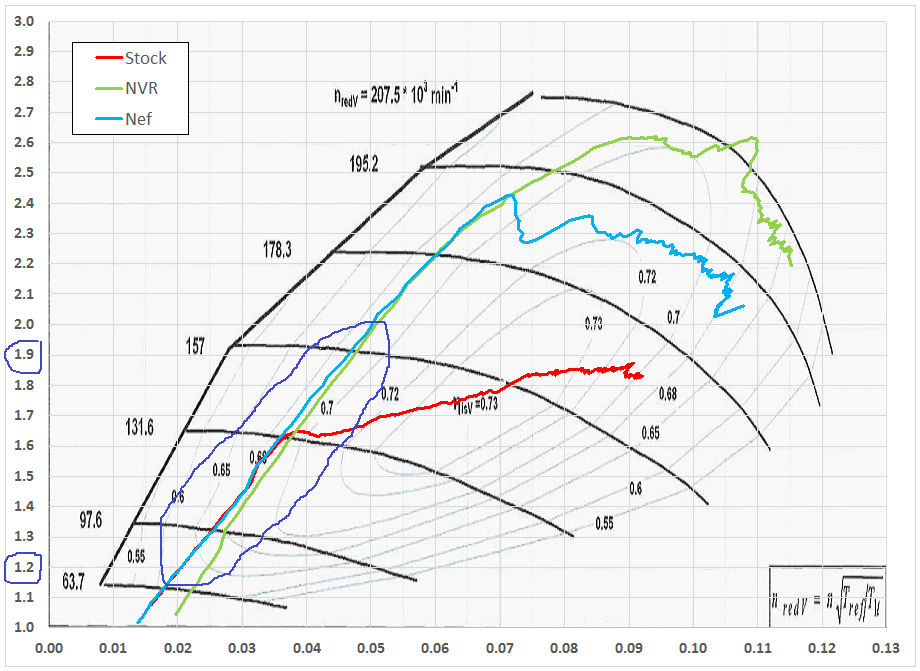
the pressure ratio, (turbocharger outlet pressure divided by the inlet pressure), does generally rise with the increasing rotation of the compressor wheel, and the manifold pressure is a result of the turbocharger outlet pressure, after some of the intake piping pressure losses are taken into account.
While rising boost pressure is not a perfect substitute for the rotational rate of the compressor wheel, (the line of boost pressure rising is not parallel with the left hand speed line), it is pretty close, and it is an adequate substitute for my purposes.
The 2-11 psi range is approximately 1.2 to 1.9 on the PR axis.
How about measuring the rotational rate of the compressor wheel, could that been done? Yes. Garrett sells a speed sensor kit that retails for around $450. It involves machining the turbo’s compressor housing so the sensor has a line of sight to the compressor wheel. Unfortunately it will only be good on a single turbocharger, and as my effort has involved multiple turbochargers this is not a cost effective option. Of course if someone is willing to fund the effort to purchase and install these systems on multiple turbochargers and then pay for the altered turbo’s they should contact me to make arrangements.
Yet another concern related to the affect other variables may have on the outcome. This is something that I make a reasonable effort to control, but have limitations to work with. A comment made to me was in relation to the vehicle weight and is worth looking into further:
“the weight of the car will effect turbo performance the same as overall acceleration. Weight = load. Load = drive. Drive = boost. Every variable you have mentioned being afraid of skewing the acceleration test is also skewing your spool testing”
Rather than load the car up with extra weight I decided to simulate a weight change by performing a series of pulls going uphill, and a series going downhill. Then using ECUxPlot I’ve graphed the calculated acceleration (g’s) versus engine speed for each pull, shown below.
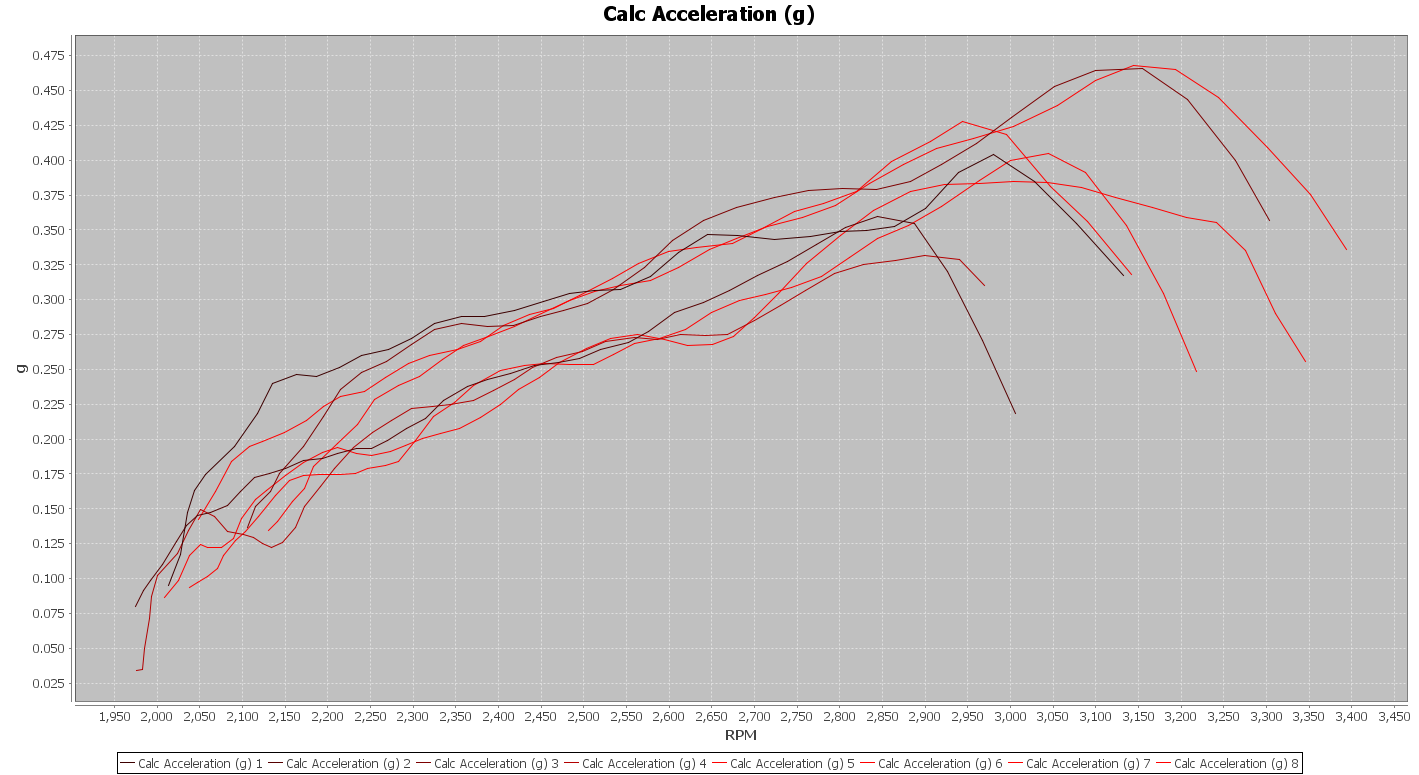
The affect of the road angle on vehicle acceleration is clearly evident.
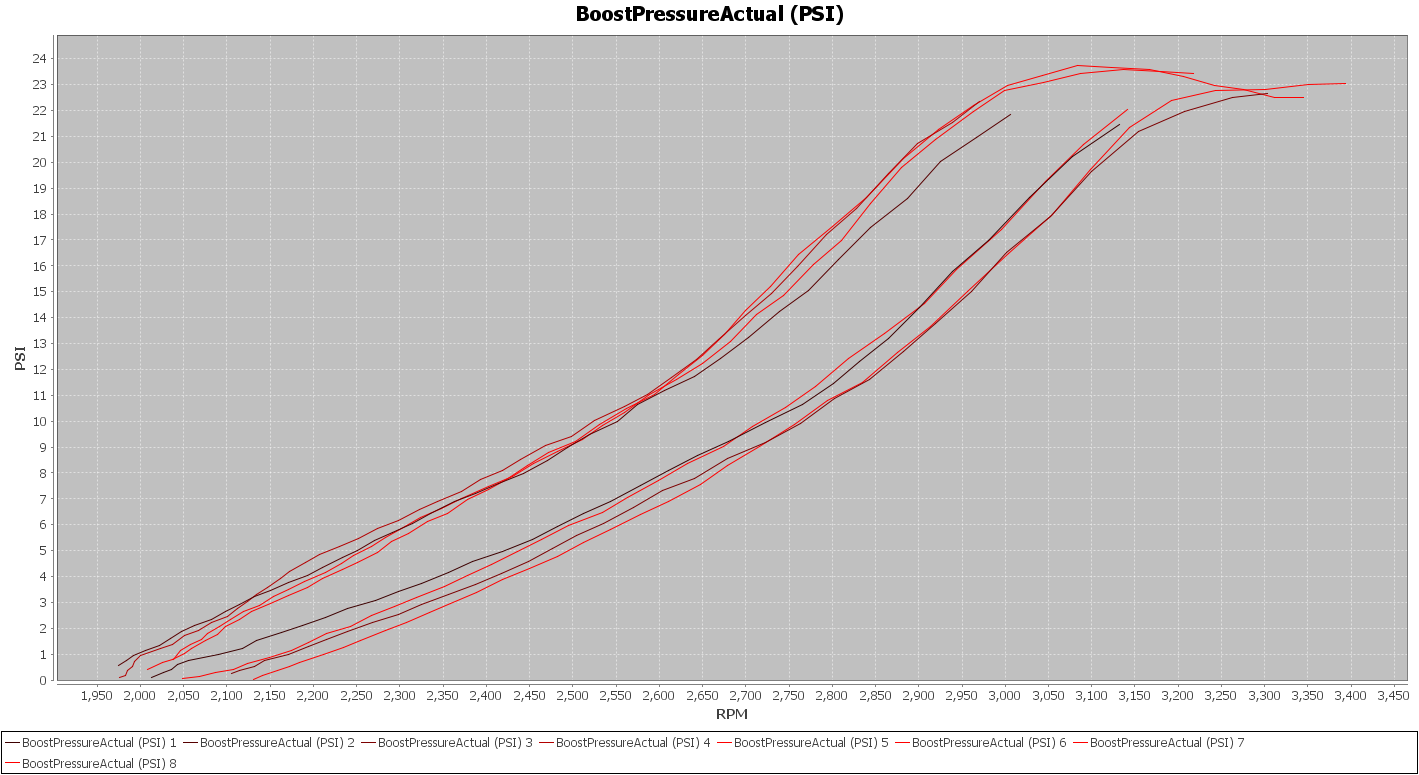
How about the affect on boost?
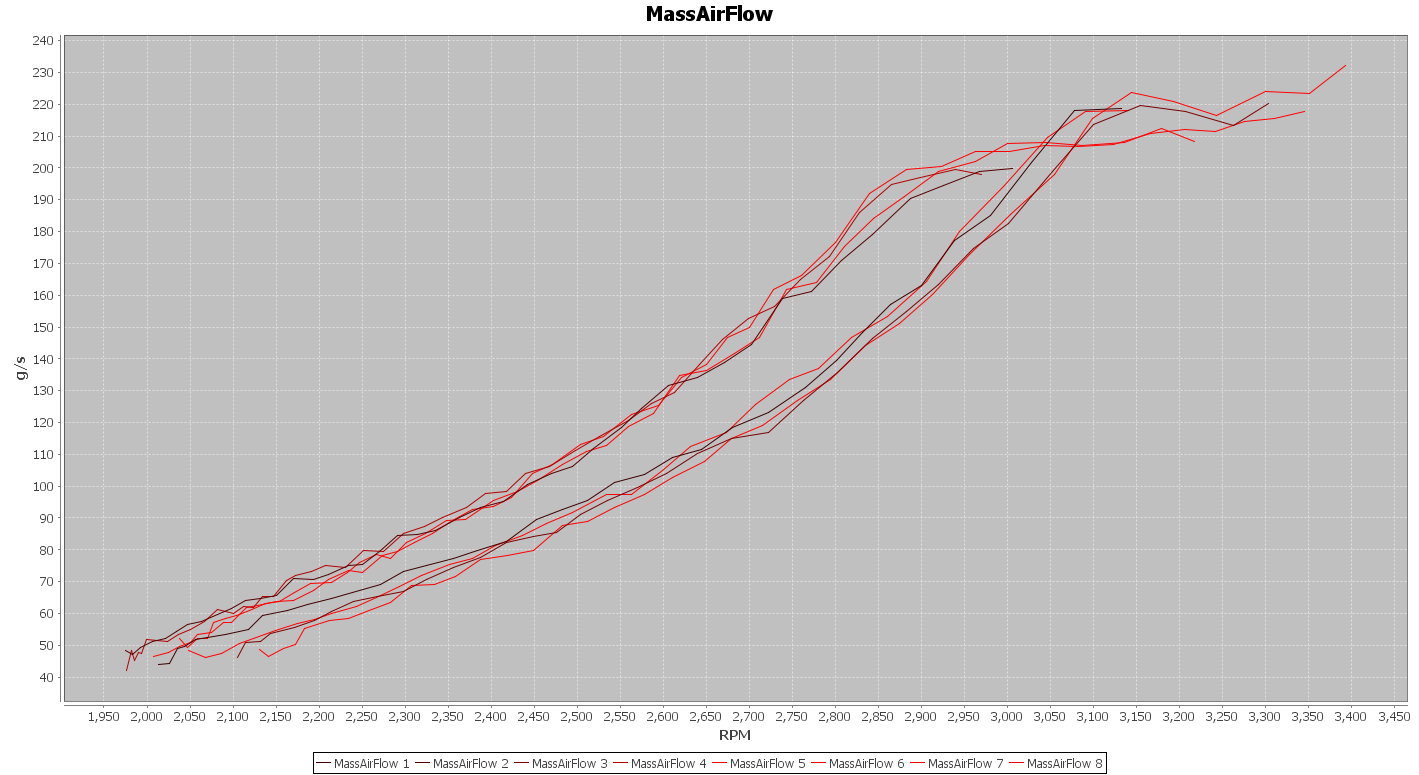
Or if you prefer, airflow:
I believe that these measurements are strongly influenced by the road angle variable. But how about spool rate? This is what ECUxPlot calculates:
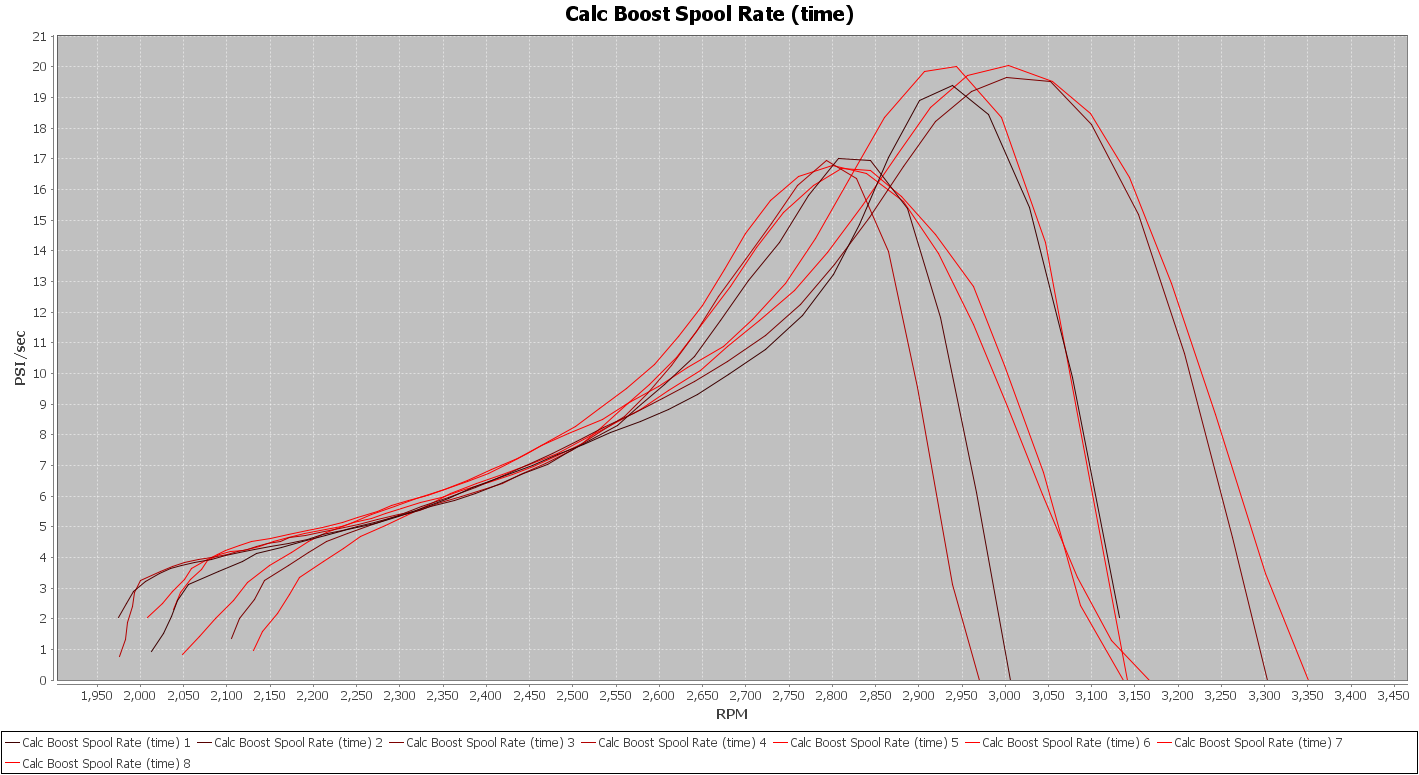
The two conditions, uphill and downhill, only start to break out into distinctive trends around the 9-11 psi/sec (2600-2700 rpm). On the boost only chart this occurs when the boost curve is between 9-11 psi for the two road conditions. Spool rate is not affected as much by the road angle as the acceleration curves are.
Placing this series of pulls into the format I have chosen gives the following result:
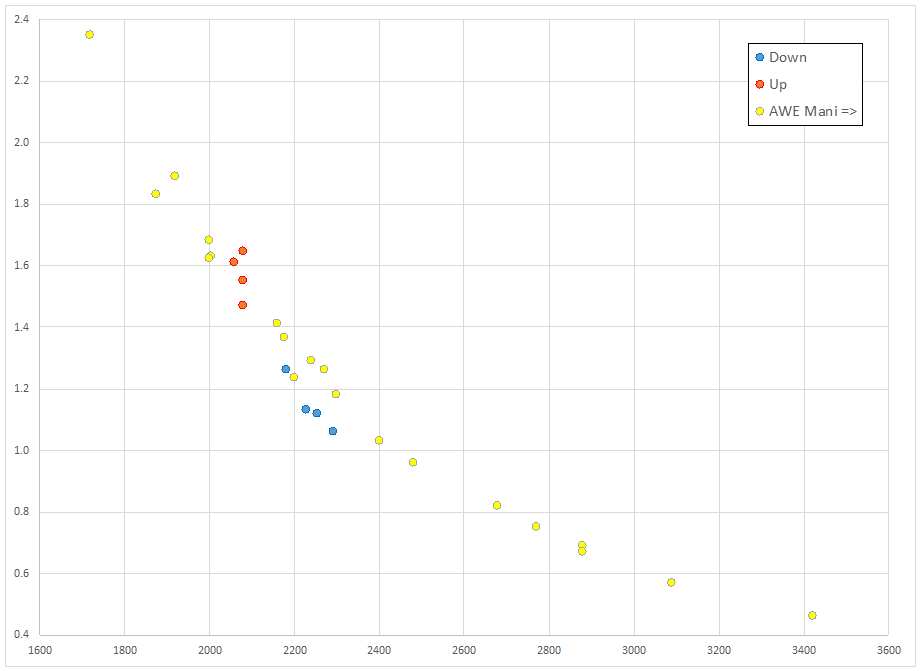
Downhill appears to have a slight influence on the time, while uphill looks to follow the trend line for all of the data points.
The bottom line from this investigation is that I now feel the 2-11 time is less sensitive to vehicle weight than acceleration, dispelling concern raised about how spool and acceleration are equally affected by the vehicle weight.
Going forward it is worth considering the concerns raised about measurements such as this, but it is also important to weed out and ignore uninformed objections or those that are raised out of spite.