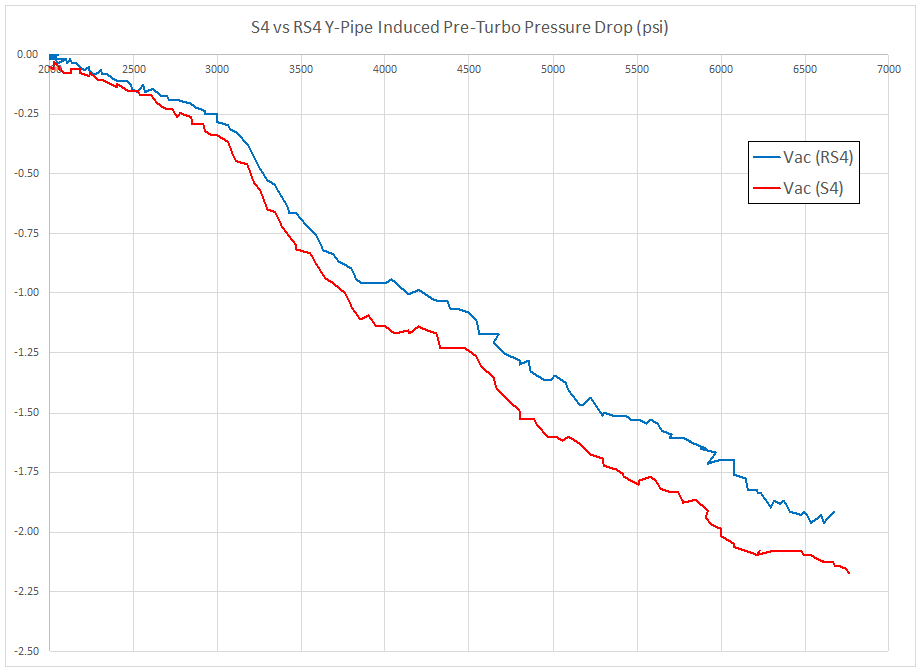
A comparison of pre-turbocharger pressure loss recorded with these two Y-pipes is shown below:
S4 vs RS4 Y-Pipe Pressure Drop
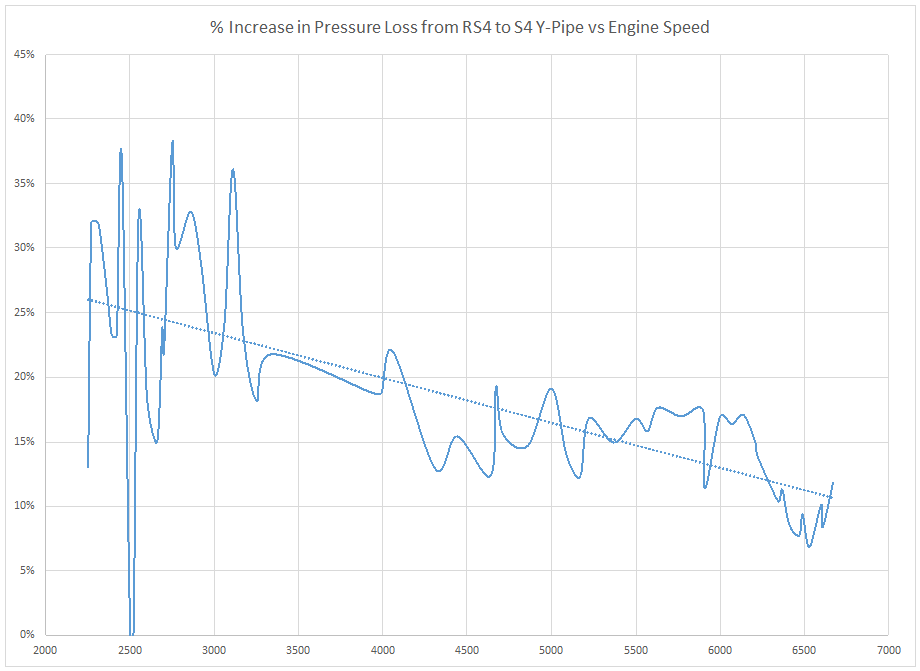
Expressed as a percentage increase in pressure drop when going from the RS4 to S4 Y-pipe the results look like:
RS4 to S4 Y-pipe Percentage P-Loss Increase
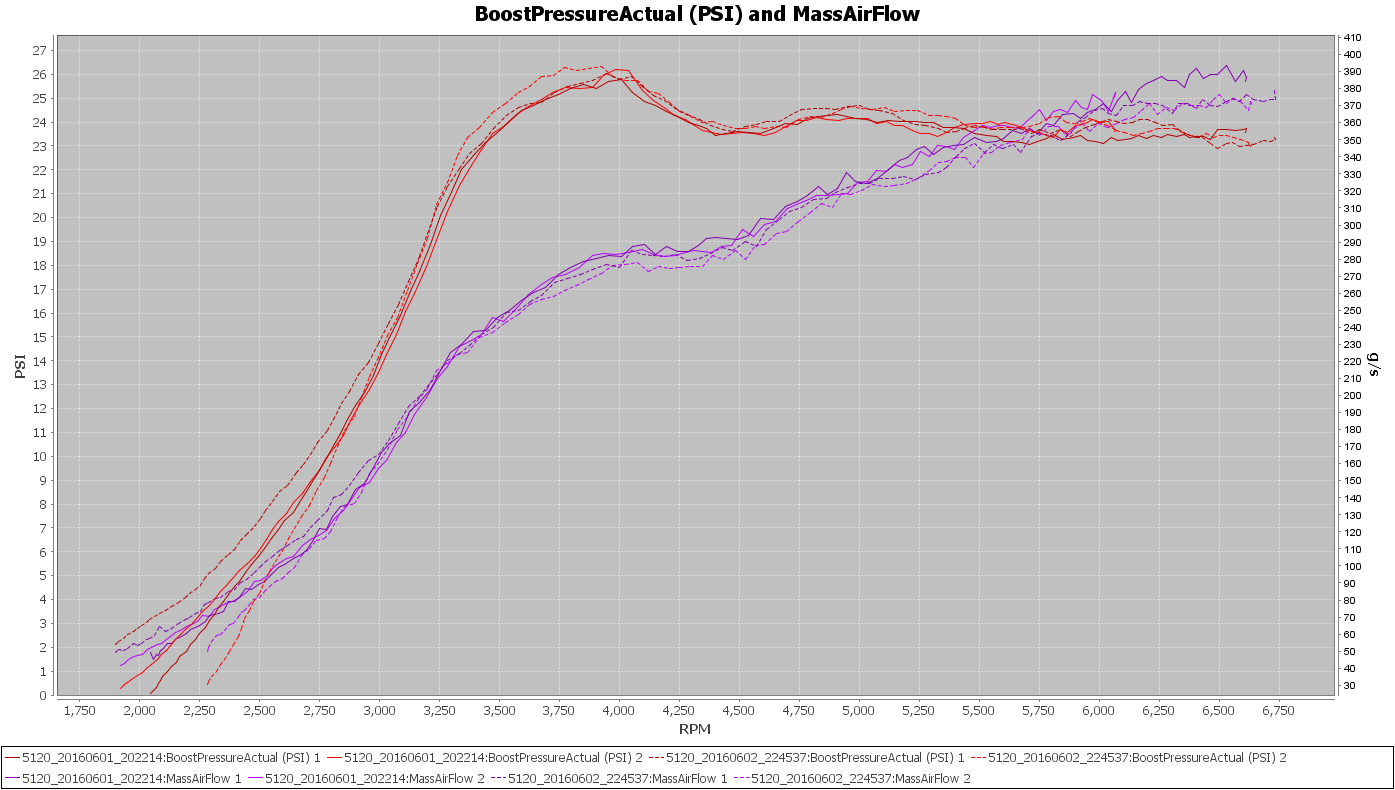
The boost and MAF readings for these two cases is presented in the chart below:
S4 vs RS4 Y-Pipe Boost & MAF curves
While there clearly is a measurable gain in using the RS4 Y-pipe instead of the S4 Y-pipe it is unclear if the difference would translate into a performance increase for the engine.
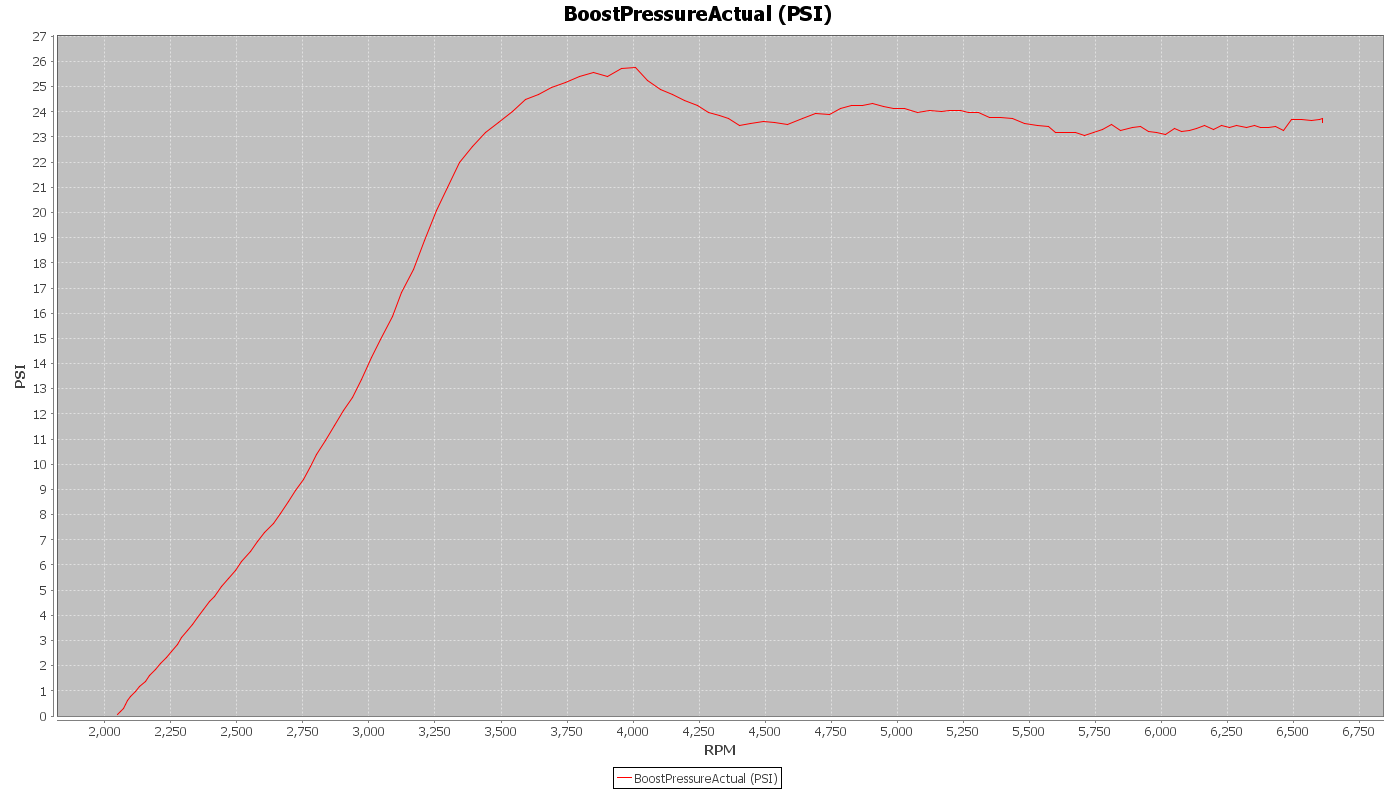
I am continuing to record some pre-turbocharger compressor inlet pressure drop as I did with the K03 turbo pressure drop. Now I am using the TTE550 turbochargers operating with a significantly higher boost pressure. With this Stage 3 setup I presently have the following boost profile:
TTE550 Boost Profile
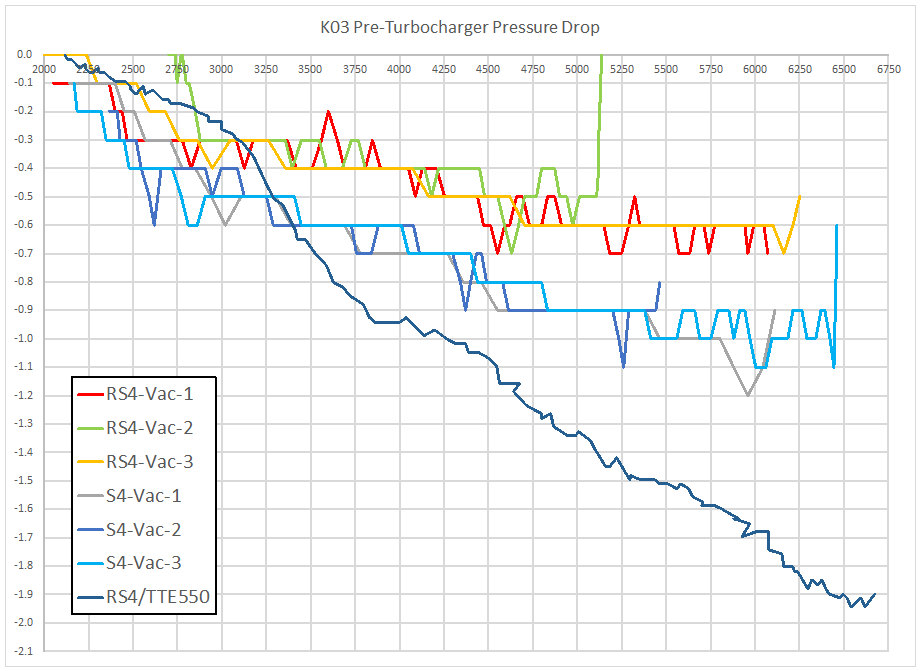
Measuring the pressure drop in the turbo inlet pipe produces these results. Note: All data not specified as TTE550 is from the BW K03’s.
TTE550 Pre-Turbo Pressure Drop w/ RS4 Intake Parts
Not surprisingly the pressure drop is greater with the Stage 3 setup as there is more airflow through the inlet for an equivalent engine speed.
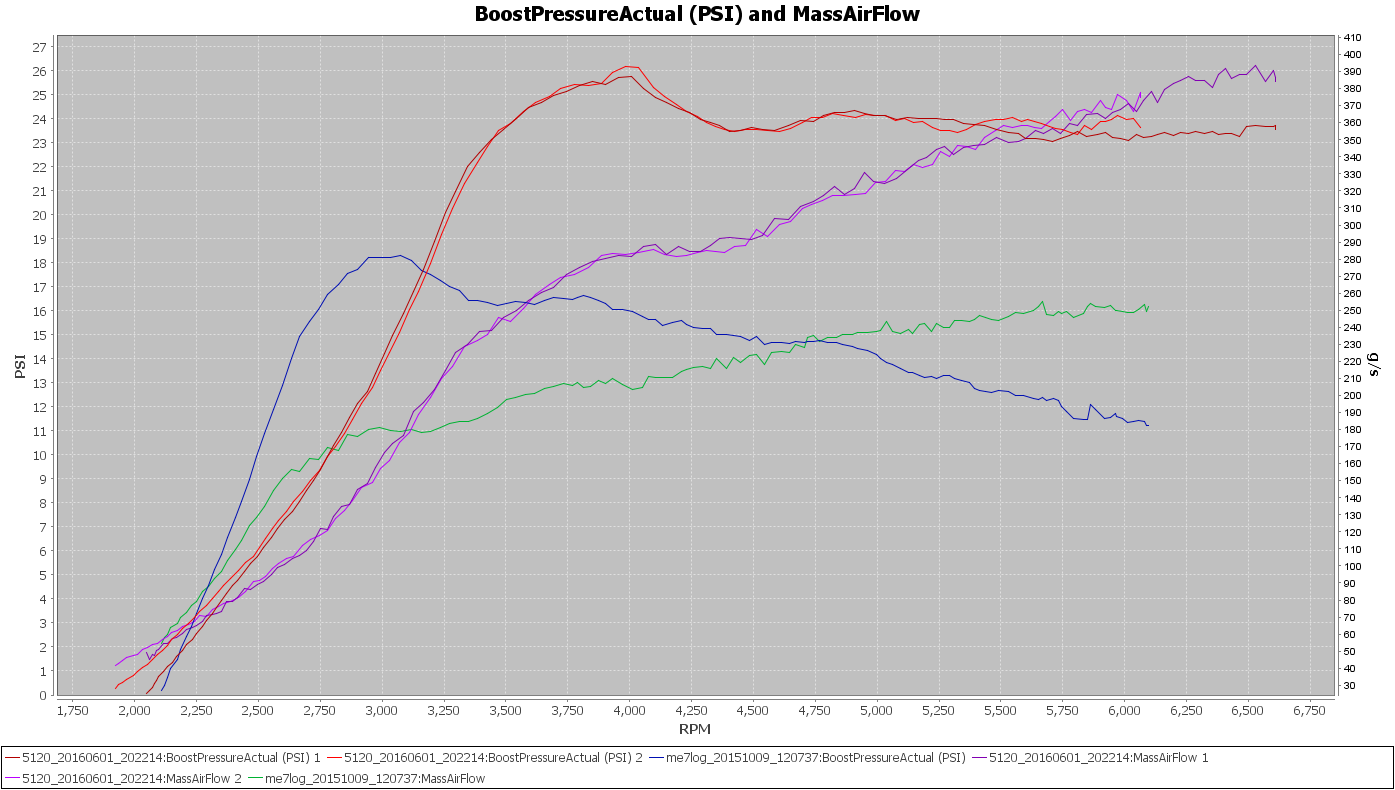
Below is a comparison of the K03 vs TTE550 Boost and MAF readings during these collection sessions. The greater boost and MAF lines are produced by the TTE550’s.
TTE550 vs BW K03 Boost and MAF
Interesting fact: K03’s reached 15 psi at 2667 RPM, TTE550 reached 15 psi at 3042 RPM — 375 RPM later.
Recently I posed a question to someone about a boost chart they had created inquiring about the gear the car was in when the log was generated. In their response they had stated the gear was not a matter of concern as the chart was showing boost rise versus engine speed, where if it had been boost pressure versus time then it would have mattered.
This answer contradicted results I have recorded on my car but I did not have a good comparison set of data to use to illustrate my point, that gear does matter.
So I set out to collect some data when accelerating wide-open-throttle (WOT) in third gear and sixth gear and commencing the acceleration from a very low engine speed, 1000 rpm.
Recently I have been trying to refine the tune on my S4 for the actual wastegate duty cycle generated boost levels, an effort that has involved operating the turbochargers with fixed wastegate duty cycles. I loaded up a tune that uses a fixed 95% WGDC that would allow the turbochargers to spool up at maximum rate to see how spool up compared between gear selections.
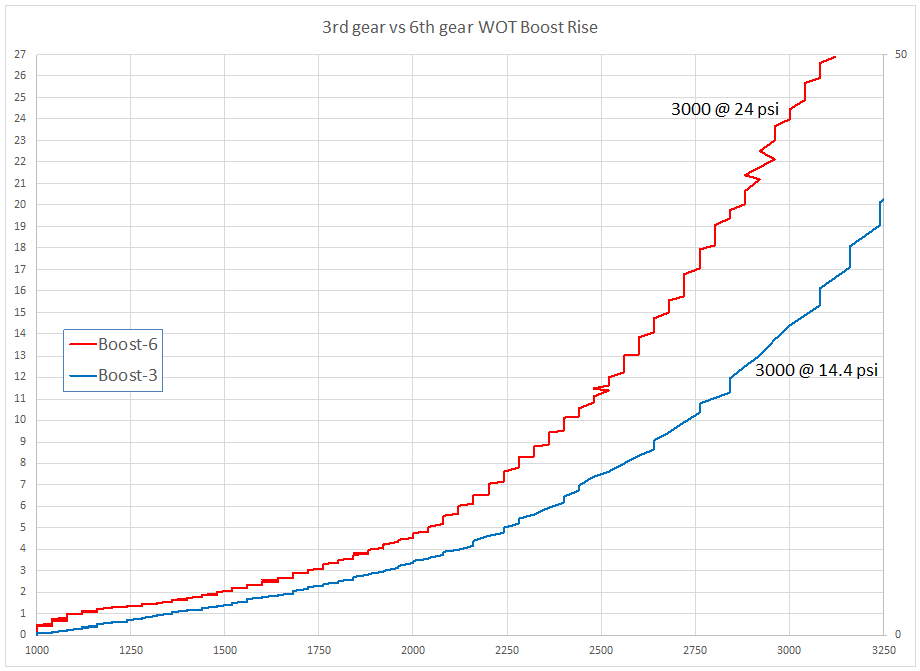
What I recorded with this purpose generated data confirmed other observations I’ve made, boost ramps up more quickly in 6th gear versus 3rd gear when plotted versus engine speed.
3rd vs 6th gear boost rise
The difference is quite dramatic, by 3000 rpm the 6th gear boost pressure is 10 psi higher than at the same engine speed in 3rd gear.
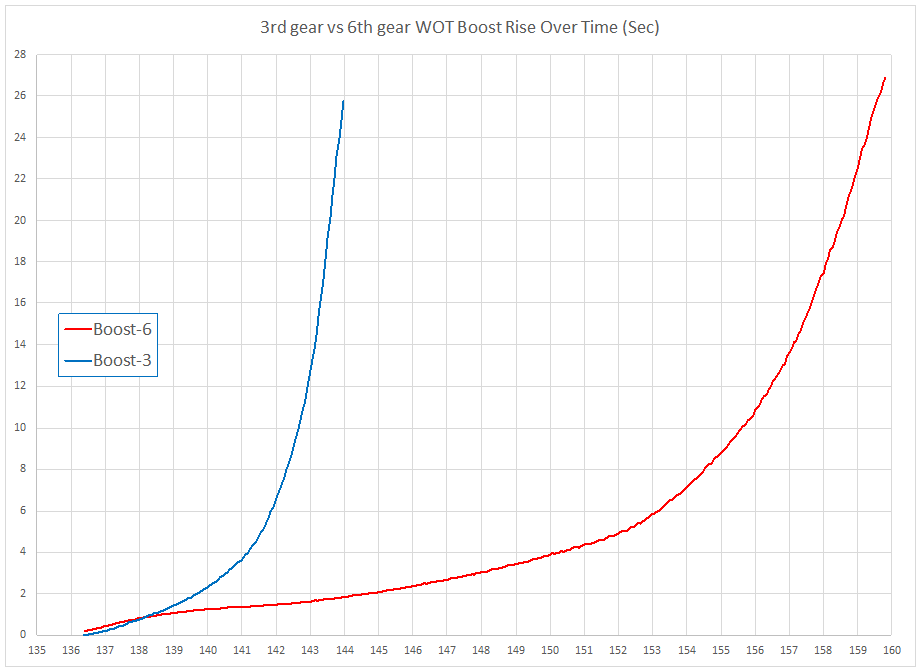
On the other hand, plotting the boost rise versus time shows boost rising much more quickly in 3rd gear versus 6th gear:
3rd vs 6th Boost rise over time
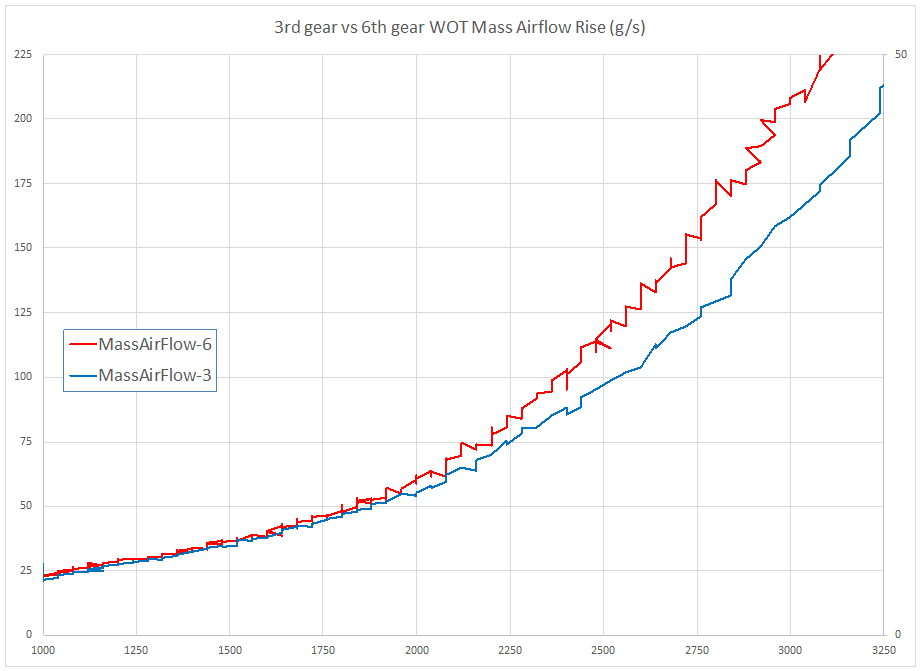
Returning to charts plotted in the more common format, against engine speed, it can be seen that Airflow rises following the rise in Boost pressure.
3rd vs 6th MAF rise
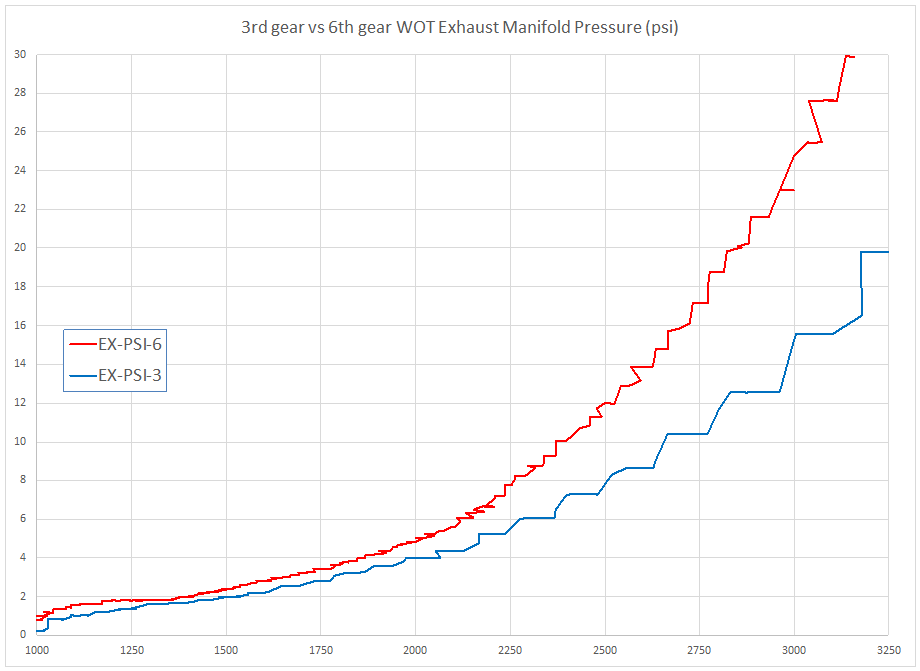
Also rising with Intake Manifold Pressure is the pressure in the Exhaust Manifold, again following the boost pressure rise pattern for 6th and 3rd gears.
3rd vs 6th Exhaust Manifold Pressure Rise
So a question now could be, if MAF and Exhaust Pressure increase with the rising Intake Manifold Boost Pressure, why is the Boost Pressure rising more rapidly in 6th gear? What is driving the faster Boost increase in 6th gear as compared to 3rd for the same engine speeds (RPM)?
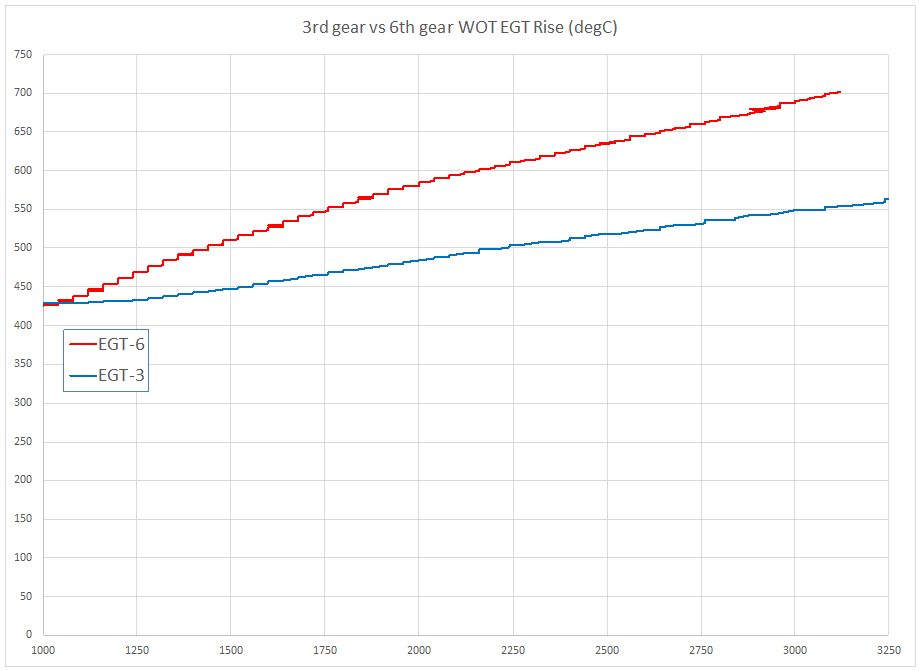
The answer probably comprises a number of contributors, but I suspect the most dominant influence is from the Exhaust Gas Temperature. As the ‘versus time’ plot from above shows, in 6th gear the time is substantially longer for boost to rise, this would mean that there is more time to generate higher temperatures in the exhaust gas due to the components along the exhaust path heating up. By heating up, these parts are drawing less energy from the exhaust gas stream leaving more heat energy to be extracted by the turbocharger turbine.
Taking a look at the Exhaust Gas Temperature, shown below, it can be seen that when accelerating in 6th gear the exhaust gas temperature rises a greater amount than when in 3rd gear.
3rd vs 6th EGT rise
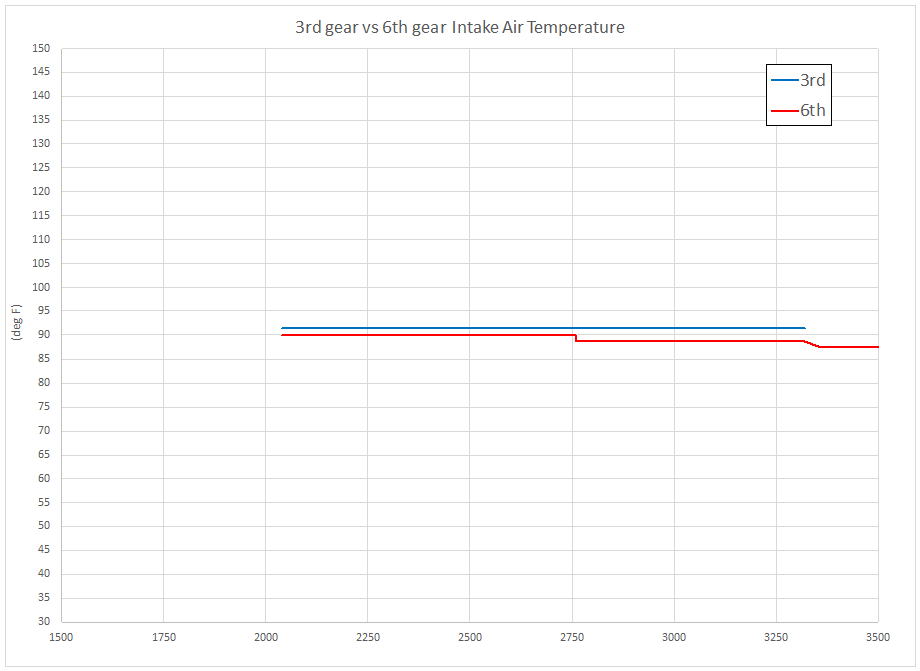
Finally, with the Intake Air Temperature contributing the the rate of boost rise I tried to ensure that both cases were tested using similar IAT’s. I was mostly successful as shown below.
3rd vs 6th IAT rise
Finally, what’s the point to take away from this? That when looking at a boost log that is plotted versus engine speed it is important to consider what gear the S4 is in as that selection can greatly (10 psi difference in this case) impact the performance produced.